Strategy One
Incremental Dashboard Rendering
Starting in Strategy One (December 2025), the preview feature Enable parallel visualization rendering is replaced by the out-of-the-box Enable Incremental Dashboard Rendering. The dashboard is incrementally rendered during the initial execution. The query execution progress displays and visualizations are loaded incrementally as data is available. This provides quicker access to visualizations, since smaller ones can display without waiting for slower, larger ones to render. Additionally, if the dashboard's Execution Mode is set to Load Chapters on Demand or Load All Chapters and Pages, you can switch between pages and chapters before the initial full dashboard load is complete. This preview function is disabled by default. See Enable the Parallel Visualization Rendering Preview Feature.
Starting in Strategy One (October 2025), the display of the query execution progress is a preview feature. Use the Visualization Load dashboard property to allow end users to view the query execution progress when running a dashboard. This provides greater insight into which execution steps take more time, how long they can expect to wait before the query is complete, and how they can optimize their queries.
Starting in Strategy One (September 2025), incremental visualization rendering is a preview feature. Use the Visualization Load dashboard property to load visualizations incrementally as data is available. With this setting, smaller visualization are no longer blocked by slower and larger visualizations. Use this setting so users can view quick access insights without unnecessary delays.
Preview features are early versions of features and are not to be used in a production environment as the core behavior remain subject to change between preview and GA. By selecting to expose preview features, you can access and use them as you would any other functionality. The official versions of preview features are included in subsequent releases.
Enable the Parallel Visualization Rendering Preview Feature
This process is no longer needed beginning in Strategy One (December 2025), when incremental rendering is available out of the box.
-
Open the Strategy REST API Explorer by appending
/MicroStrategyLibrarywith/api-docs/index.html?visibility=allin your browser. -
Create a session and authenticate it. In the Authentication section, use
POST /api/auth/admin/login. -
Click Try Out and modify the request body by providing your user name and password.
-
Click Execute.
-
In the response, find
X-MSTR-AuthToken. -
To get the current feature status:
-
Under the Configurations section, look up
GET /api/v2/configurations/featureFlags. -
Click Try Out.
-
Set the proper
X-MSTR-AuthTokenfrom step 5. You can also get this via inspecting the browser network XHR requests. -
Click Execute.
-
Search for
Incrementally Render Dashboardin the response body to find its status details.
-
-
Under the Configurations section, look up
PUT /api/configurations/featureFlags/{id}. -
Click Try Out.
-
Set the proper
X-MSTR-AuthTokenfrom step 5. You also can get this via inspecting the browser network XHR requests. -
Set
idto749902F631724C9FBFB55A619C03727D. -
To enable this preview feature, set the
statusvalue to1. -
Click Execute.
-
Repeat step 6 to verify that the feature is enabled.
Enable the Page-Switching Preview Feature
By default, you cannot switch pages before the initial full dashboard load is complete. To enable this function, complete the following steps. This preview feature is available beginning in Strategy One (December 2025).
-
In
<MicroStrategy Library>/WEB-INF/classes/config/configOverride.properties, add the feature flagfeatures.enablePageSwitchOnIncrementalRender=true. -
Restart Strategy Library.
-
Open the dashboard to enable page-switching for.
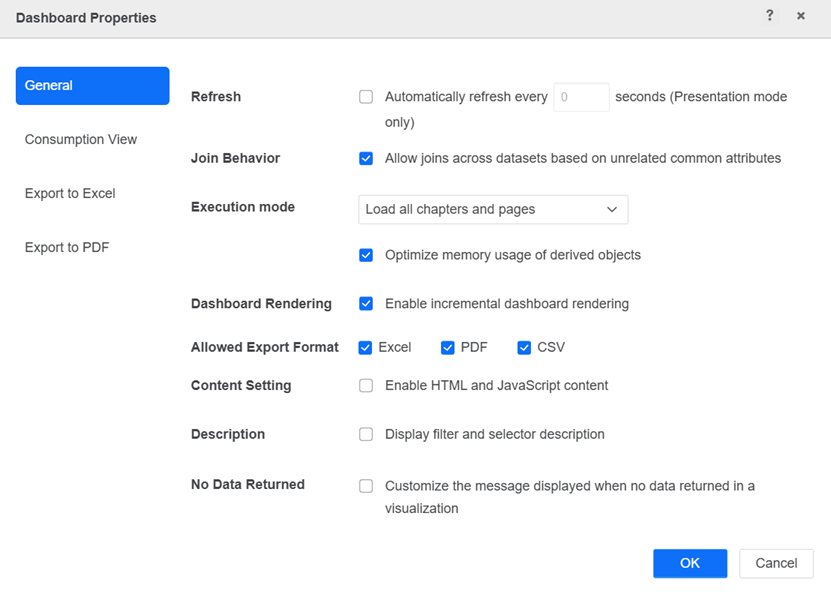
- From the File menu, select Dashboard Properties.
Starting in Strategy One (September 2025), a new Dashboard Editor is available. If you have enabled it, from the Dashboard menu, select Dashboard Properties.
-
Select the Enable Incremental Dashboard Rendering check box.
-
Whether you can switch pages before the initial full dashboard load is complete depends on the dashboard execution mode.
-
If the Execution Mode is set to Load All Chapters and Pages, you can switch to all chapters and pages before the initial full dashboard load is complete.
-
If the Execution Mode is set to Load Chapters On Demand, you can switch to all pages in the current chapter before the initial full dashboard load is complete.
-
If the Execution Mode is set to Load Pages On Demand, you cannot switch to any other page before initial full dashboard load is complete.
After the current page is fully rendered, you can switch to any other page or chapter, and the target page is incrementally rendered.
-
-
Save the dashboard.
Enable Incremental Dashboard Rendering
-
Open a dashboard.
- From the File menu, select Dashboard Properties.
Starting in Strategy One (September 2025), a new Dashboard Editor is available. If you have enabled it, from the Dashboard menu, select Dashboard Properties.
- Click General in the navigation bar on the left.
-
Select the Incremental Dashboard Rendering check box.
-
Prior to Strategy One (December 2025), use the preview feature. Select the check box next to Enable parallel visualization rendering.
-
Click OK.
Dashboard Execution Step Descriptions
When the feature is enabled, end users can see these dashboard execution steps:
-
Initializing dashboard: Loading dashboard definition.
-
Calculating datasets: Calculating a portion of the datasets in a dashboard that includes dynamic selectors and utilizes live-connect datasets.
-
Preparing data: Calculating derived attributes and groups for a dashboard with dynamic selectors and live-connect datasets.
-
Evaluating selectors: Resolving dynamic selector selections for a dashboard with dynamic selectors and live-connect datasets.
-
Running datasets: Running the datasets used by the dashboard. Beginning in Strategy One (December 2025), you can switch between pages when this stage starts.
-
Preparing data: Calculating derived attributes and groups used in the dashboard.
-
Rendering dashboard: Generating and displaying the data.