Strategy ONE
Designing and creating documents
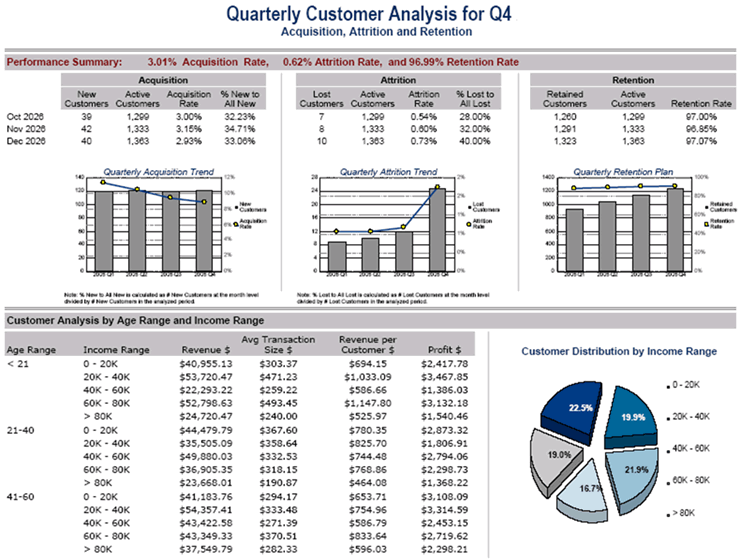
A MicroStrategy Report Services document contains objects representing data coming from one or more MicroStrategy reports, as well as images and shapes. Documents can appear in almost as many ways as you can imagine and are generally formatted to suit your business needs, in a single display of presentation quality. A sample document is displayed below:
This section describes the ways in which you can design and create a MicroStrategy Report Services document. It builds on the basic concepts about documents presented in Getting started with documents. Before you begin creating a document, you should understand how end users will use documents for data analysis. For instructions and examples of manipulating data in documents, see Getting started with documents and the Document and Dashboard Analysis Guide. If you are new to designing documents, see Best practices for designing effective documents before you begin a new document.
Creating documents
As document designers create documents, they specify the data that appears and control the layout, formatting, grouping, and subtotaling of data. In addition, they can insert pictures and draw borders in the document. All of these capabilities provide for documents that are suitable for presentation to management for printing boardroom quality material. They are used to create the highest-quality, Pixel Perfect™ documents such as scorecards and dashboards, managed metrics documents, production and operational documents, and more.
-
While you can connect an older MicroStrategy Developer client to a newer Intelligence Server (such as an 8.1.x MicroStrategy Developer client and a 9.x Intelligence Server), none of the newer 9.x functionality for Report Services documents is supported.
-
If some fonts are not available on an Intelligence Server installed on the UNIX operating system, copy True Type fonts into the Intelligence Server installation directory. For more information on supporting non-Western European fonts in documents, see Setting Up Documents and HTML Documents in the Installation and Configuration Help.
An overview of designing and creating documents
First, you open a blank document and select a report to use as the document's dataset. The dataset report of a document contains the MicroStrategy objects that can be displayed in the document. These objects include attributes, custom groups, consolidations, and metrics. You can select more than one dataset report to include on the document. You must define one dataset as the grouping and sorting dataset; you can group and sort only by the objects on this dataset. For detailed instructions to create a document, see Creating documents.
For details on how the data from multiple datasets is joined, see Using datasets in documents. For more information on grouping and sorting documents, see Grouping records in a document and Sorting a document. For basic information on MicroStrategy reports in general, see the Basic Reporting Help.
After you create a document, you add controls to the document. Controls are the objects that display the data, images, and shapes in a document; they are the objects shown in the document's Layout area as you design the document. A control can be a:
-
Text field, which displays text such as:
-
Data (attributes, consolidations, custom groups, and metrics) from the document's dataset reports. See Adding text and data to documents for examples and instructions.
-
Static text for labels. See Adding static text to documents for examples and instructions.
-
Information about the document (such as page numbers) and the dataset reports (such as report names and filter information). See Displaying document and dataset report information: Auto text codes for examples and instructions.
-
Metrics created within the document, which use the metrics on the dataset reports to obtain data not directly available from the datasets. These include derived metrics, calculated expressions, and summary metrics. For instance, a calculated expression combines metrics from different dataset reports. For more examples, and instructions to create them, see Working with metrics in documents.
-
-
HTML container, which displays real-time information from the web. For more information on creating HTML containers, see Displaying HTML content in a document: HTML containers.
-
Line or Rectangle. For more information on creating lines and rectangles, and examples of how they can be used, see Adding lines to documents and Adding rectangles to documents.
-
Image. For more information on creating images, see Adding images to documents.
-
Grid/Graph, which displays data in the same way that a MicroStrategy report does. For more information and examples, see Displaying reports in documents: Grid/Graphs.
Other types of controls, such as selectors and widgets, provide interactivity and visually intuitive graphic images. These controls are most commonly used on interactive documents, which are a specific type of document. However, their use is not limited to interactive documents; you can use them on any document. These types of controls include:
-
Panel stack, which is a holder for a collection of panels, or layers of data, in a document. A user can navigate or flip through the panels in a panel stack; only one panel is displayed at a time.
-
Selector, which allows users to interact with the document, by flipping through the panels in a panel stack or by displaying different attributes or metrics in a Grid/Graph.
-
Widget, which displays the results of a dataset report in Flash in MicroStrategy Web, allowing users to visualize data in different ways than traditional reports displayed as Grid/Graphs do.
For a more in-depth presentation of interactive documents and these controls, as well as examples and instructions to create them, see Designing dynamic, interactive documents.
Each of these different kinds of controls is referred to as a control type.
Dragging and dropping a dataset object onto the Layout area of the Document Editor creates a control. If the dragged object is a dataset report, a Grid/Graph is created; otherwise, a text field containing the dataset object is added to the Layout area. When the document is displayed as a PDF, the Grid/Graph is displayed like a MicroStrategy report; the text field displays the elements or values of the dataset object.
Where a control is placed in the Layout area (which document section, that is) determines not only the location of the values but also whether it is repeated and at what level it is calculated. For example, some document sections, such as the Page Header or Page Footer, are appropriate for displaying page numbers because those sections are automatically repeated throughout the document.
A metric placed in different document sections is calculated differently. In the Detail section, the metric is calculated at the level of the attribute element, while the same metric placed in the Group Header section is calculated at the level of the group. For a more in-depth description of the various document sections, including explanations of where they appear when the document is generated and the type of information they typically contain, see Working with sections in documents.
After you add controls, you can move and arrange them to determine how they appear when the document is viewed as a PDF. For instructions and examples of the various ways in which you can move and arrange controls, see:
You can format the document as a whole, and also the separate controls that are included in the document. For information on the formatting available in documents, including instructions and examples, see Formatting documents.