Strategy One
Introduction to KPI Visualizations
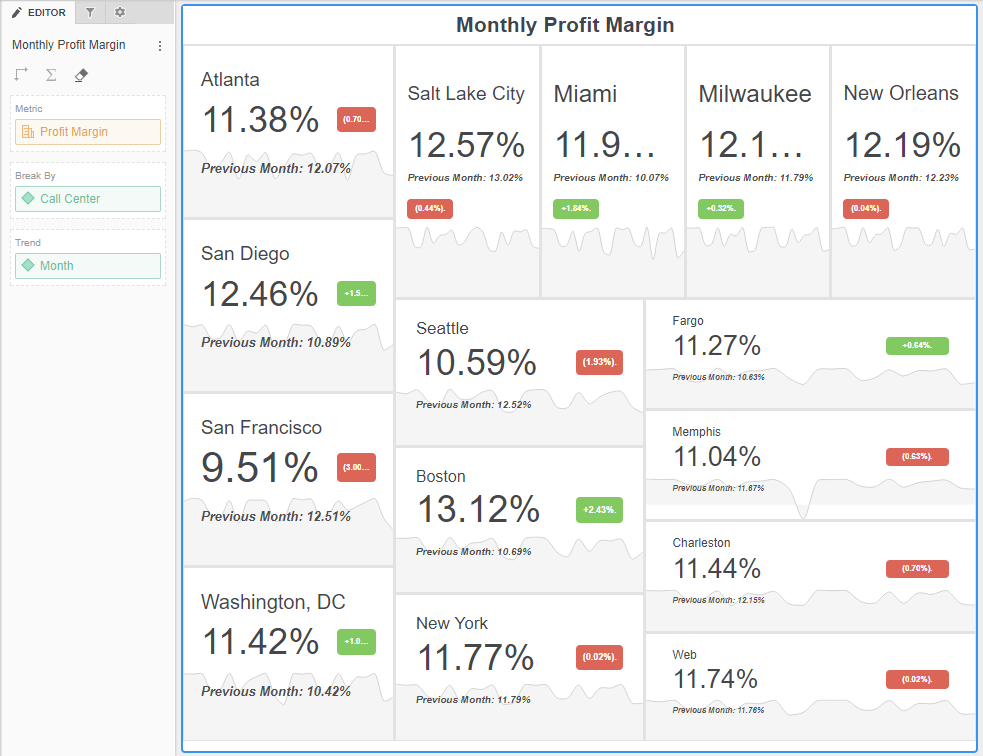
A KPI (Key Performance Indicator) visualization is a visual representation of a performance indicator, that is a main data point in a dashboard. You can visualize the total value of a metric or how a metric, such as profit or revenue, trends over time. A KPI visualization may contain one or more attributes and at least one metric. You can break a single KPI card into multiple KPI cards using an attribute in the Break By area of the Editor panel.
Related Topics
-
Creating KPIs:
-
Create and Format an Iconic KPI Visualization
-
Formatting KPIs:
-
Working with KPIs: