Strategy One
Add Nested Labels to Graphs
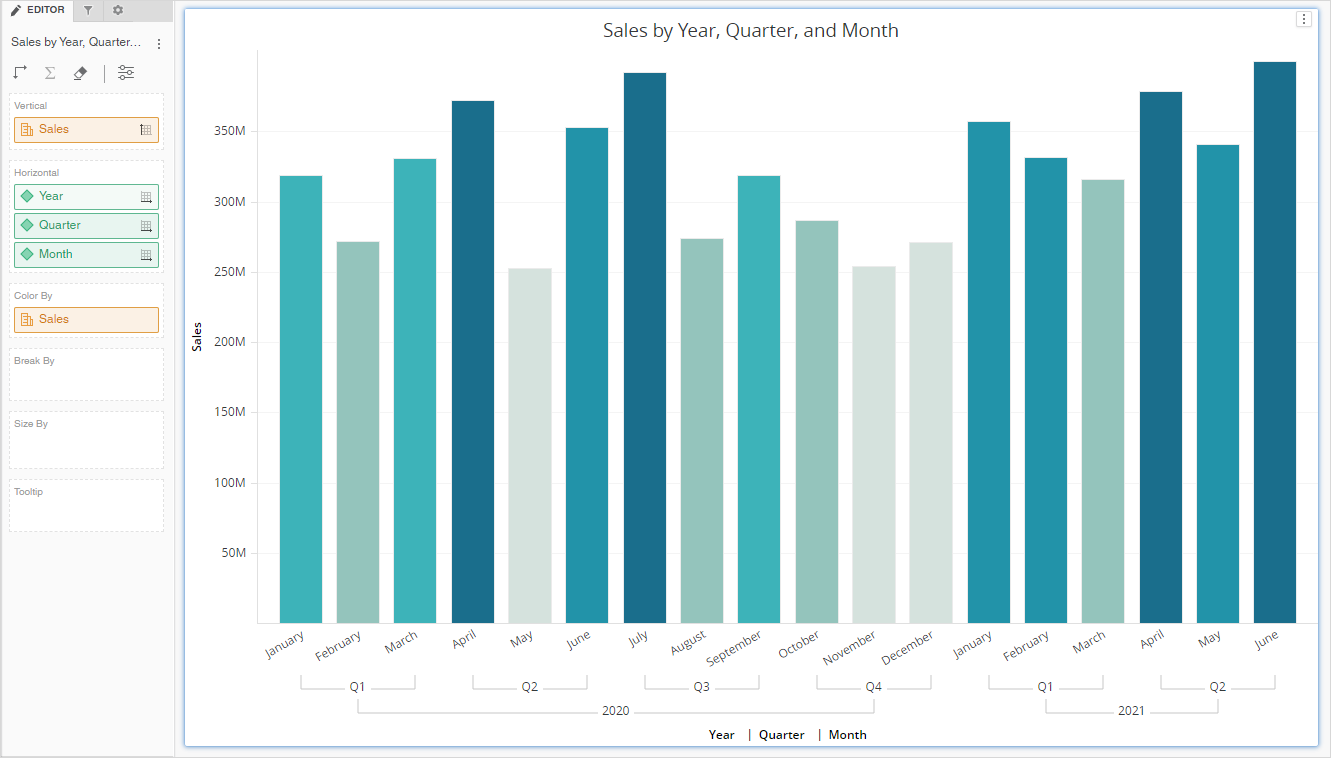
Nested axis labels display hierarchical information in a meaningful, easy-to-read manner. For example, time-based data like Year, Quarter, and Month, or geographic data like Region and Country benefit from nesting, or grouping, sub-elements under the relevant parent. You can use nested labels in bar, line, area, dual-axis, pie, ring, bubble, and scatter graphs.
-
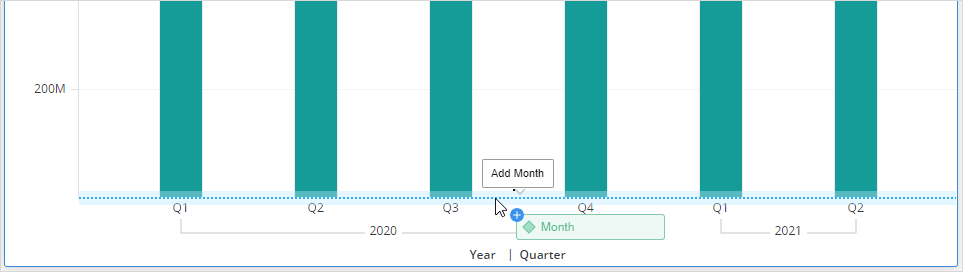
Drag and drop the attributes onto the axis in relevant order.
-
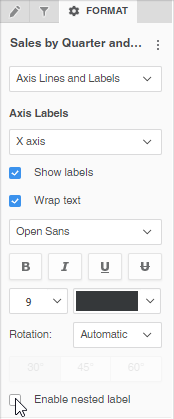
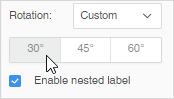
If necessary, disable nested labels by deselecting Enabled nested label in the Format panel.
-
To avoid truncation in the x-axis, enable label rotation in the Format panel. Consider abbreviating longer words or strings.
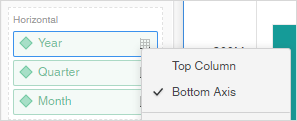
You can also use the Editor panel to place the attributes in relevant order along the axis.