MicroStrategy ONE
View Dashboards
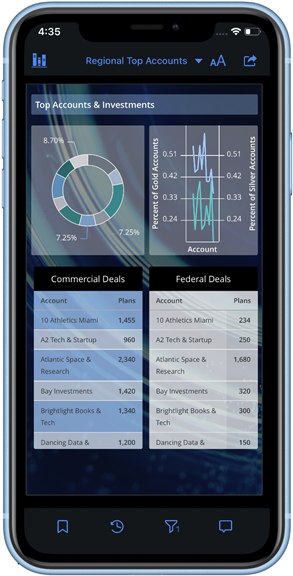
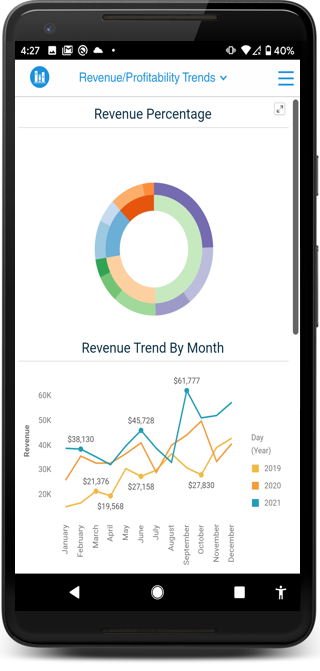
In Library, dashboards appear as interactive applications where users can tap on visualizations to view their values or drill for more information. To view a dashboard, go to the Library landing page and tap a dashboard tile.
- iOS
- Android


The title of the drop-down varies depending on what page you are on. Use the drop-down to navigate between pages and chapters in your dashboard.
Create bookmarks to save the current view of your dashboard, including filters and in-canvas manipulations.
After performing any dashboard manipulations, click reset to return to your original dashboard version.


The title of the drop-down varies depending on what page you are on. Use the drop-down to navigate between pages and chapters in your dashboard.

More
By default, the dashboard options are hidden to allow for better readability. Tap More to see your dashboard options.
After performing any dashboard manipulations, click reset to return to your original dashboard version.


