Strategy ONE
WeightedMean
An average, also known as an arithmetic mean, is the sum of a set of values divided by the number of values in the set.
A weighted mean allows you to apply a weight, or relative significance to each value when determining an average. Values with a higher value for their weight are considered as more significant when compared to the other values.
To calculate an average without applying a weight to the values, see Avg (Average).
Syntax
WeightedMean<FactID>(Argument1, Weight)
Where:
Argument1is an attribute, fact, or metric representing a list of numbers that are used to calculate an average.Weightis an attribute, fact, or metric representing a list of numbers to define the weight of each value.FactIDis a parameter that forces a calculation to take place on a fact table that contains the selected fact.
Expression

Example
You can calculate a weighted mean to apply greater significance to certain values used to determine an average. For example, you can use the percent growth of revenue as a way to define revenue values as more or less significant for an average. The report shown below contains the attribute Customer Region and the metrics Revenue, Percent Growth, Average Revenue, and Weighted Mean Revenue. The report also includes the Year attribute in the page-by to show results by year.
The expressions for the average and weighted mean calculations are as follows:
- Average Revenue:
Avg(Revenue){Year} - Weighted Mean Revenue:
WeightedMean(Revenue, [Percent Growth]){Year}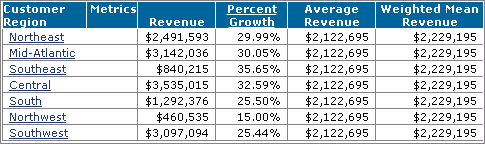
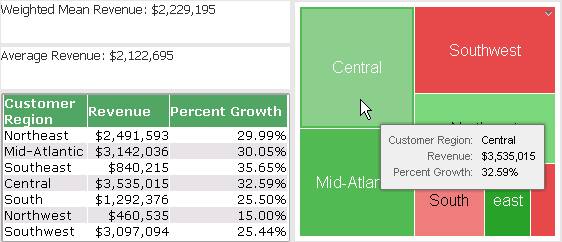
The weighted mean takes into account the weights of each revenue value. For example, since Central's percent growth is greater than Northwest's percent growth, and the weight in this example is the percent growth, Central's revenue is given more significance in the weighted mean calculation. This results in $2,229,195 for the Weighted Mean Revenue as compared to $2,122,695 for the Average Revenue for all customer regions for the given year.
Notice that while the Average Revenue and Weighted Mean Revenue are applicable to a year in this example, the values are displayed for every Customer Region row. One way to simplify the display of this information is to include this data on a dashboard. You can include the Average Revenue and Weighted Mean Revenue results in text fields along with additional visualizations of the data, as shown below.