Strategy ONE
ExpWghMovingAvg (Exponential Weighted Moving Average)
ExpWghMovingAvg allows you to place more or less emphasis on recent data than on past data within a specified number of rows. It is calculated within the specified window size and can restart based on an attribute specified in the function parameters.
Syntax
ExpWghMovingAvg <BreakBy, SortBy> (Argument, WindowSize, Rate)
Where:
BreakByis the attribute indicating where the calculation restarts.SortByis the attribute or metric by which the data is sorted.Argumentis a metric representing a list of numbers.WindowSizeindicates the number of values to use in each calculation.Rateis a positive real number specifying the base weight applied to each argument value. In the calculation, exponents are sequentially applied to the rate value. Assign a rate of less than one to give more emphasis to more recent data; assign a rate of greater than 1 to give greater emphasis to past data.
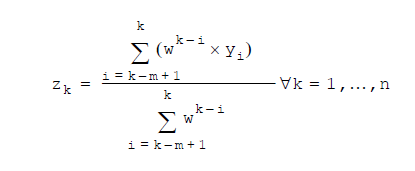
Expression
Where:
k= row number-
yi= metric value at the ith row m= window size or the row number, whichever is smallern= number of rows-
w= the base weight applied to each value, which is determined by theRatevalue in the function, as described in the function syntax details aboveRows with null values are excluded from the calculation.
Example
This example uses small numbers to demonstrate the calculation for the exponential weighted moving average (ExpWghMovingAvg) function. For example, you have a list of values (32, 8, 5), with 5 being the most recent value, and you assign a rate of .5 and a window size of 2.
| Values | EWM average | Calculation |
|
32 |
32 |
32(.5)0 / (.5)0 = 32(1)/1 = 32
|
|
8 |
16 |
8(.5)0 + 32(.5)1 / (.5)0 + (.5)1 = 8(1)+ 32(.5) / 1+.5 = 8+16 / 1.5 = 16 |
|
5 |
6 |
5(.5)0 + 8(.5)1 / (.5)0 + (.5)1 = 5(1)+ 8(.5) / 1+.5 = 5+4 / 1.5 = 6 |
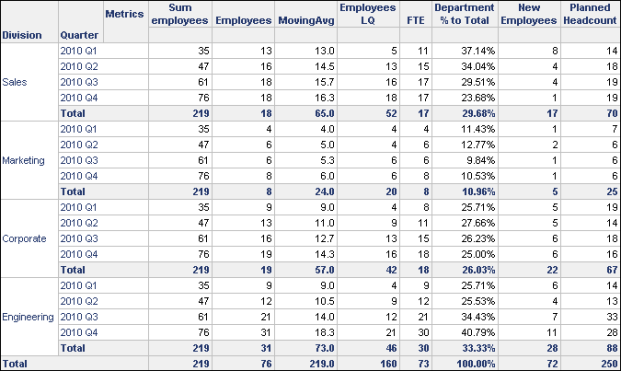
As an additional example, the Human Resources Analysis Module project includes the Division Breakdown report shown below.

A description of how the MovingAvg metric is used on the report is provided in MovingAvg (Moving Average). You can also add an exponential weighted moving average metric to this report to apply more or less emphasis to older data. For example, you can create another derived metric named ExpWghMovingAvg with the following expression:
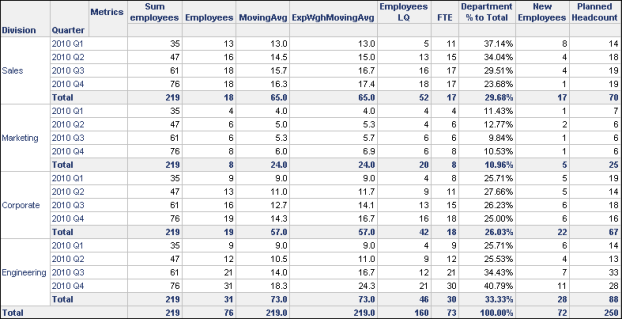
ExpWghMovingAvg<BreakBy={Division}, SortBy=(Quarter)> (Employees, 4.0, 0.5)
The rate of 0.5 changes the moving average to apply more significance, or weight, to more recent data. This means that the number of Sales employees during the first quarter (13) has less weight than the number of Sales employees in the fourth quarter (18). When comparing MovingAvg and ExpWghMovingAvg for the Sales division, you can see that the ExpWghMovingAvg is larger. This is because more significance is given to more recent data, and the recent trend is that employment is on the rise. This is shown in the report below.

Conversely, you can modify the same ExpWghMovingAvg metric to use the following expression:
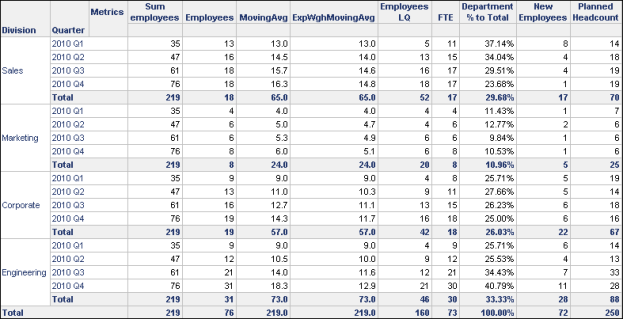
ExpWghMovingAvg<BreakBy={Division}, SortBy= (Quarter) >(Employees, 4.0, 2)
The rate of 2 changes the moving average to apply more significance, or weight, to older data. This means that the number of Sales employees during the first quarter (13) has more weight than the number of Sales employees in the fourth quarter (18). When comparing MovingAvg and ExpWghMovingAvg for the Sales division, you can see that the ExpWghMovingAvg is smaller. This is because more significance is given to older data, and employment was lower earlier in the year. This is shown in the report below.


