Strategy ONE
MovingAvg (Moving Average)
Returns the moving average of the current value and preceding values, as defined by the WindowSize parameter. The calculations can be restarted based on attributes set in the function parameters. This is an OLAP function.
Syntax
MovingAvg <BreakBy={}, SortBy=()> (Argument, WindowSize)
Where:
BreakByis the attribute indicating where the calculation restarts.SortByis the attribute or metric by which the data is sorted.Argumentis a metric representing a list of numbers.WindowSizeis a positive integer indicating the number of values to use in each calculation.
Expression

Where:
yi= metric value at the ith rowm= window sizen= number of rows/metric values
Example
This simple example illustrates how the MovingAvg function calculates a list of values and returns the average of a specified number of values. In this case, the window size is set to 3, meaning that the value in the MovingAverage column represents the average of the current value of the two values that precede it in the value list. The calculation is shown in the following table.
| Values | MovingAverage |
|
10 |
10 (10/1) |
|
20 |
15 ((20+10) / 2) |
|
30 |
20 ((30+20+10) / 3) |
|
15 |
51.67 ((15+30+20) / 3) |
|
5 |
16.67 ((5+15+30) / 3) |
|
20 |
13.34 ((20+5+15) / 3) |
|
40 |
21.67 ((40+20+5) / 3) |
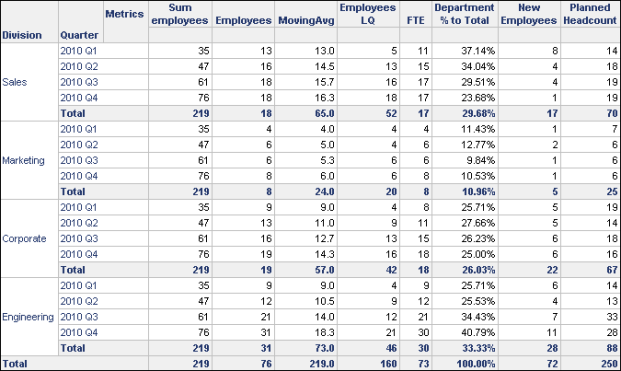
As an additional example, the Human Resources Analysis Module project includes the Division Breakdown report shown below.

This report displays details about employee headcounts for each division, over the various quarters of 2010. Included in this report is the metric MovingAvg. It is defined as a derived metric, using the following expression:
MovingAvg<BreakBy={Division}, SortBy=(Quarter)> (Employees, 4.0)
This expression calculates the moving average of employee headcount for a given division, during the four quarters of 2010. The window size of 4.0 specifies that the average is calculated across the four quarters, and BreakBy={Divison} ensures that the moving average calculation is specific to each division.
Using this MovingAvg metric, you can determine that the Sales division had between 13.0 and 16.3 employees on average during the 2010 year, with slight increases throughout the year.
For an extension of this example on how you can also use a weighted moving average, see ExpWghMovingAvg (Exponential Weighted Moving Average).
