Strategy ONE
OLAPRank
Returns the rank of the current value based on the other values defined by the sorting criteria. The ranking can be restarted based on attributes defined in the function parameters.
The OLAPRank function allows the ranking to be calculated in the database, rather than calculating the ranking using the MicroStrategy Analytical Engine.
- Since
OLAPRankis calculated in the database, you can only use this function if your database supports theOLAPRankfunction. - Any metrics that use the
OLAPRankfunction must not be defined as smart metrics. If metrics that useOLAPRankare defined as smart metrics, the calculation is performed in the MicroStrategy Analytical Engine and an error is returned. - You must include at least one metric in the
SortByparameter.
Syntax
OLAPRank<BreakBy, SortBy>()
Where:
BreakByis the attribute indicating where the ranking restarts.SortByis the attribute or metric by which the data is sorted. ForOLAPRank, theSortByparameter is also where you can include the metric to perform the calculation on. You must include at least one metric in theSortByparameter.
Example
The MicroStrategy Tutorial project includes an Avg Revenue per Customer metric. This metric can be placed on a report along with the attributes Quarter and Region to display the quarterly average revenue per customer for each region.
To extend this analysis, you can create an OLAPRank Avg Rev per Customer metric as defined below:
OLAPRank<BreakBy={Quarter}, SortBy= ([Avg Revenue per Customer], Region@ID) >()
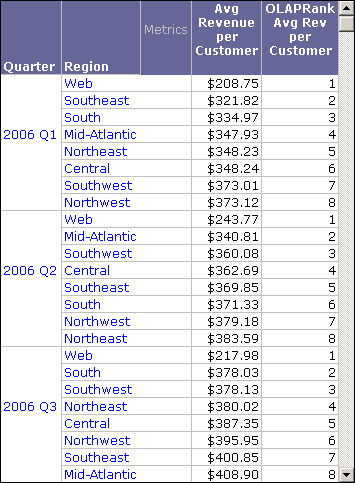
When this metric is included on a report with Quarter, Region, and Avg Revenue per Customer, it displays the regional rank of the quarterly average revenue per customer for each region. This is shown in the report below.
The report has been sorted by Quarter, and then by the OLAPRank Avg Rev per Customer values.

The report shown above displays regions based on their average revenue per customer for each quarter, sorted from the lowest average revenue per customer to the highest. This analysis allows you to quickly see how regions are performing based on average revenue per customer over different quarters. In the first three quarters of data shown above, Web has the lowest average revenue per customer. However, there is some variation in the performance of the other regions. Performing this analysis over extended periods of time can help to show trends in revenue and regional performance.
