MicroStrategy ONE
WeightedCorr (Weighted Correlation)
A correlation of two values describes the degree to which the values are related or associated. Values that are closely related with either a positive or negative correlation will have a correlation close to 1 or -1 respectively, while values that are not correlated at all will have a correlation close to 0.
A weighted correlation allows you to apply a weight, or relative significance to each value comparison. Correlation comparisons with a higher value for their weight are considered as more significant when compared to the other value comparisons.
To determine the correlation of two values without applying a weight to the comparisons, see Correlation.
Syntax
WeightedCorr <FactID> (Argument1, Argument2, Weight)
Where:
FactIDis a parameter that forces a calculation to take place on a fact table that contains the selected fact.Argument1andArgument2are attributes, facts, or metrics representing lists of numbers for comparison. A correlation is calculated on these values to determine the level of association between the two values.Weightis an attribute, fact, or metric representing a list of numbers to define the weight of each comparison.
Expression

Where:
xandyare the values being compared.wis the weight applied to each comparison.
Usage Notes
- The correlation coefficient is measured on a scale that varies from 1 to - 1. So only a value between -1 and 1 is returned.
- Complete correlation between two variables is expressed by either 1 or -1. When one variable increases as the other increases, the correlation is positive. When one decreases as the other increases, the correlation is negative. Complete absence of correlation is represented by 0.
- If an array or reference argument contains text, logical values, or empty cells, those values are ignored; however, cells with the value zero are included.
- If
Argument1andArgument2have a different number of data points, an error is returned. - If either
Argument1orArgument2is empty, or if the standard deviation of their values equals zero, an error is returned.
Example
Your company keeps employee statistics including their overall satisfaction with their job and role at the company, as well as their performance score. While these are both important statistics, it can also be beneficial to know how closely related these two statistics are. Knowing this information can help determine if an employee's satisfaction with their job is related to their performance.
A report including both the correlation and weighted correlation of these statistics, displayed as percentages, is shown below for employees at the executive level:
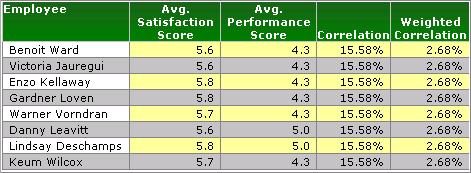
The expressions for these calculations are as follows:
-
Correlation:
Correlation([Avg. Performance Score], [Avg. Satisfaction Score]) {Level , ~ }
-
Weighted Correlation:
WeightedCorr([Avg. Performance Score], [Avg. Satisfaction Score], Tenure) {Level, ~}
Both the correlation and weighted correlation indicate that employee satisfaction and performance are positively correlated, meaning that when one increases so does the other. The weighted correlation includes an employee's tenure into the correlation calculation. This means that more significance is given to correlation comparisons for employees that have been with the company longer.
For the executive level employees, factoring in tenure results in a smaller correlation between satisfaction and performance. This type of analysis can be crucial in determining how performance can be improved or maintained both for new hires and long tenured employees.