Strategy ONE
Lead
The Lead function is useful to display a set of metric values in an order determined by another metric or attribute on the report. This allows you to compare metric values side-by-side. The easiest way to understand the Lead function is with an example, provided below.
Syntax
Lead <BreakBy, SortBy> (Argument, Offset, DefaultValue)
Where:
BreakByis the attribute indicating where the calculation restarts.SortByis the attribute or metric by which the data is sorted.Argumentis an attribute or metric representing a list of values. It is common to use a metric forArgument.Offsetspecifies the offset from the current row to display information for. This offset precedes ahead of the current row (you can use theLagfunction to use an offset that trails behind the current row, see Lag). For example, with an offset of two, row one displays data for the row two ahead of it, which would be row three.DefaultValueis the value displayed for any entries that do not have any data due to the offset. For example, when using an offset of 2, the last two entries use the default value.Some common default values to display include:
- 0: To display a value of 0 for any entries that do not have any data due to the offset, type
0. - No data: To display no data for any entries that do not have any data due to the offset, type
ZeroToNull(0).
- 0: To display a value of 0 for any entries that do not have any data due to the offset, type
Example
For an example of using Lag and Lead functions to perform transformation-style analysis, see Transformation-Style Analysis Using the Lag and Lead Functions.
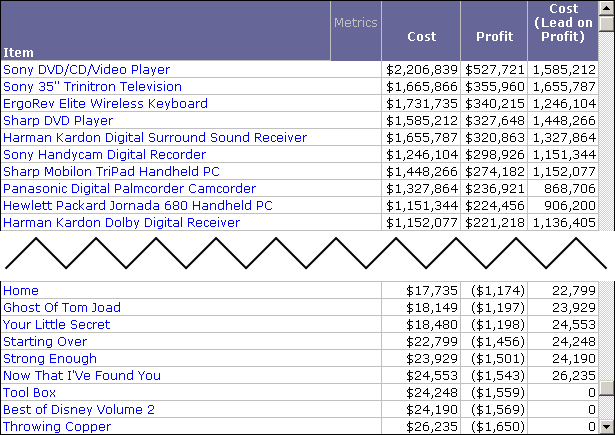
On a report with Item, Cost, and Profit, you can use the Lead function to create a Cost (Lead on Profit) metric. This metric displays Cost values based on the descending sort order of the Profit metric, and is defined with the following expression:
Lead<SortBy= (Profit Desc) >(Cost, 3.0, 0.0)
Notice that the offset is set to three, meaning that the display of cost values is displayed three ahead of the current value. This is displayed in the report results shown below.
Only the top and the bottom of the report is shown. To view the entire report results, you can create this report in the MicroStrategy Tutorial project.

The Cost (Lead on Profit) values are displayed three ahead of the Cost metric, and are displayed based on the descending sort order of Profit. Notice that with an offset of three, the last three entries for Cost (Lead on Profit) use the default value of zero. Also, the first three values of Cost are not included in the Cost (Lead on Profit) metric.
The report has been sorted based on the Profit metric to make the Cost (Lead on Profit) values easier to analyze.
