MicroStrategy ONE
Line
A Line graph is a type of graph that highlights trends by connecting lines between different data points. Like the Bar graph and Pie chart, the Line graph is one of the most commonly used graph types. It is often used as a visual alternative to Bar graphs and other types.
Line Graph Types
You can create many different types of Line graphs in MicroStrategy, including the following:
- Horizontal Line and Vertical Line styles:
- Absolute
- Stacked
- Bi-polar Absolute
- Bi-polar Stacked
- Dual-axis Absolute
- Dual-axis stacked
- Percent
- 3D Line styles:
- Series
- Group
Vertical Line: Absolute Graph Example
One of the many variations of vertical Line graphs you can create in MicroStrategy is the Vertical Line: Absolute graph.
The following graph highlights the amount of revenue generated for various subcategories of Electronics per month.
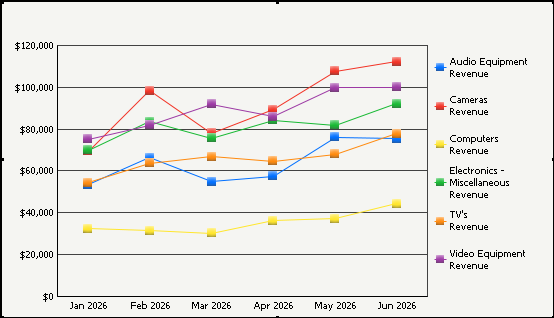
Each colored line in the graph represents a different electronics subcategory, such as Cameras or TVs. The X-axis represents different months in chronological order and the Y-axis represents the amount of revenue. The upper most line in the graph represents Camera revenue. To analyze how much revenue was generated during a specific month, follow the appropriate line from left to right until you reach the correct Month along the X-axis. For example, follow the line for Cameras to discover that, in May 2026, revenue generated by camera sales was just over $100,000.
Using Line Graphs Effectively
- The Line graph is a flexible graph format because you can create one from any number of attributes, metrics, and other report objects. Its minimum requirements are that one attribute and one metric be present on the report grid. However, as explained in Moving Objects on a Graph Report, the location of these objects on your graph report determines whether and how the grid report can be generated as a Line graph.
- You can apply a curved effect to the Line graph. To do so, from the Graph menu, select Preferences. Expand Options, and select the General category. Select the Enable curved lines check box.
- For detailed information about the specific options for Line graphs in MicroStrategy, see the MicroStrategy Developer help. (From within MicroStrategy Developer, press F1.)