MicroStrategy ONE
Area
An Area graph emphasizes changes in data values by connecting various data points along a line, and then filling in the portion of the graph beneath the line. Therefore, Area graphs can often resemble a mountain range of high peaks and low valleys, with each peak and valley representing a different data value.
Area Graph Types
You can create several types of Area graphs in MicroStrategy, including the following:
- Horizontal Area or Vertical Area styles:
- Absolute
- Stacked
- Bi-polar Absolute
- Bi-polar Stacked
- Dual-axis Absolute
- Dual-axis Stacked
- Percent
- 3D Area styles:
- Series
- Group
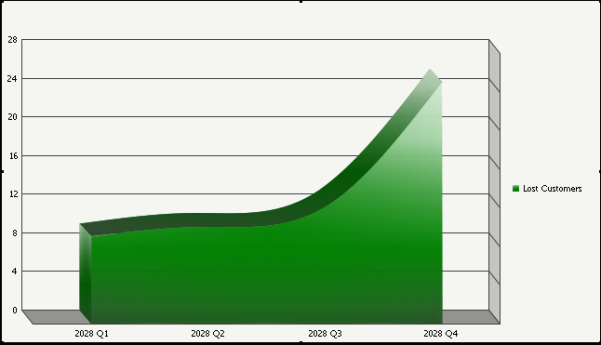
Vertical Area: Absolute Graph Example
One of the types of Area graphs you can create in MicroStrategy is a Vertical Area: Absolute graph. You can think of this type of graph as a vertical Line graph that has the area beneath it filled in a certain color.
For example, the following graph provides information about how many customers a company lost per quarter. The top edge of the graph represents the various data points, in this case, the number of customers lost. The X-axis represents the different quarters. In the graph, notice the sharp increase in lost customers between Q3 2028 and Q4 2028.
Going into Q3, the company had lost only a total of 12 customers. During Q4 alone, however, the company saw that number grow to a total of 25 customers, as shown by the highest point on the far right of the graph.
Using Area Graphs Effectively
- Overall, the Area graph is a flexible graph format because you can create one from a variety of attributes, metrics, and other report objects. Its minimum requirements are that one attribute and one metric be present on the report grid. However, as explained in Moving Objects on a Graph Report, the location of these objects on your graph report determines whether and how the grid report can be generated as an Area graph.
- You can apply a curved effect to the lines of the graph, as shown in the image above. To do so, from the Graph menu, select Preferences. Within the General category, select the Enable curved areas check box.
- For detailed information about specific formatting, scaling, and other options for Area graphs in MicroStrategy, see the MicroStrategy Developer help. (From within MicroStrategy Developer, press F1.)