MicroStrategy ONE
Using Graph Matrix widgets as selectors
A Graph Matrix widget consists of several attributes and elements in its column and row headers, and corresponding graphs at the intersection of those objects. You can enable these attributes, elements, graphs, and attribute names displayed in column headers as selectors. This allows an analyst to select an attribute, an attribute element, or a graph, and then view specific data related to it in grid and graphs in the document. An analyst can also view data related to elements from different attributes simultaneously by clicking those elements.
The following scenarios describe how Graph Matrix widgets can be used as selectors:
-
When you hover the cursor over an attribute name or attribute element that is enabled as a selector, the attribute name or element becomes a hyperlink. If you select the attribute name or element, all target Grid/Graphs and panel stacks display data related to it.
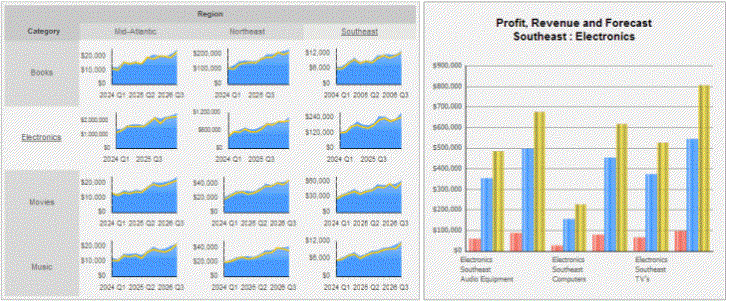
For example, the Electronics category and Southeast region are selected in the Graph Matrix widget below. Therefore, data related to the Southeast region and Electronics category is displayed in the target Grid/Graph on the right.

You cannot select multiple elements from the same attribute. If you select an attribute name from the headers, all corresponding attribute element selections are cleared. For example, if you select Category in the widget above, the Electronics category is no longer highlighted and data for all categories is displayed in the target Grid/Graph on the right.
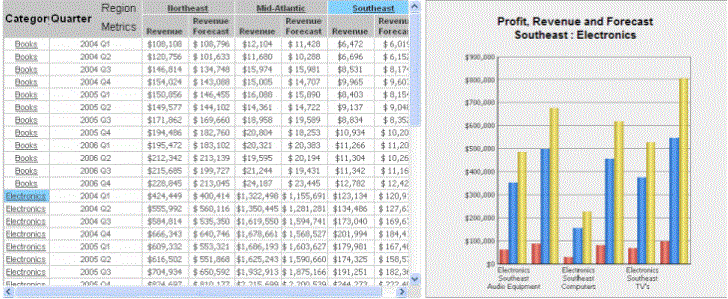
The Category and Region attributes in the Graph Matrix widget can be used as selectors because they are enabled as selectors in Editable Mode, as shown below. Notice that all categories and regions are hyperlinks because they are enabled as selectors.

-
When you hover the cursor over a graph in the widget, the cursor is displayed as a hand pointer to indicate that the graph is a selector. If you click the graph, the two corresponding attribute elements in the headers are automatically selected. Therefore, all target Grid/Graphs and panel stacks display data related to those two elements. For example, if you select the graph at the intersection of the Mid-Atlantic region and Electronics product category, all data for Electronics sales in the Mid-Atlantic region is displayed.
-
When you hover the cursor over a graph and click a specific data point in the graph, all data related to that data point is displayed in all target Grid/Graphs and panel stacks only if the time-based attribute on the Grid/Graph that contains the widget is enabled as a selector. You can also perform this task after maximizing a graph.
To use a widget as a selector, you first choose the target Grid/Graph and/or panel stack in MicroStrategy Developer. You can also do this in Design Mode or Editable Mode in MicroStrategy Web. For details and steps, Viewing data related to widgets: Using widgets as selectors.
