Strategy ONE
Showing totals for a group
After you add a group to a document, you can allow totals to be displayed for that group. For example, the following document is grouped by Year, with a total displayed for all years:
The document above shows the end result of group totals.
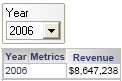
Other types of totals can also be displayed for users, including grand totals. For example, a document displays a Grid/Graph containing the Year attribute and Revenue metric. The document is grouped by Year. When the document is viewed as a PDF, a user can select a year and display a Grid/Graph with the data for that year, as shown below:
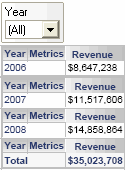
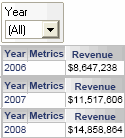
Alternatively, the user can display a single Grid/Graph for all the years, by selecting All, as shown below:
Page-by allows you to display the various years or all years; for more information on page-by, see Using page-by on a document.
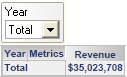
If the user needs the total of all the years in the Grid/Graph, you can allow the Year group to show a Total option in the PDF. You do not need to edit the report or the Grid/Graph. When viewed as a PDF, a Total option is added to the page-by. When a user selects it, the total revenue of all the years is displayed, as shown below:
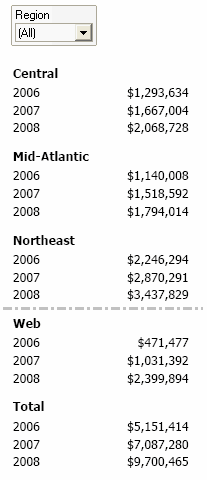
When a user selects All in the PDF, all the years and the total are displayed, as shown below:

If you disable page-by, the user cannot change the page-by from the All option in the PDF. The document always displays as shown above, with all the years and the group total. For steps to disable page-by, see Enabling page-by.
To show totals for a group
-
In MicroStrategy Web, open the document in Design or Editable Mode.
-
If the document contains multiple layouts, click the tab of the layout to modify.
-
If the Grouping panel is not displayed, from the Tools menu, select Grouping. It displays above the Layout area.
-
In the Grouping panel, right-click the grouping field to total, and select Grouping Properties. The Grouping Properties dialog box opens.
-
Select the Show option for Total check box.
-
Click OK.
Group totals and sorting
The group total is not affected by sorting. For example, a document contains the Year and Region attributes, as well as the Revenue metric. Group totals are displayed, as shown below:
The middle portion of the document has been removed to conserve space, as indicated by the dotted line.
If you sort region in descending order, Web appears at the top but Total remains at the end of the document, as shown below:

For information on sorting a group, including steps, see Sorting records in a document.
How group totals impact metric calculation on Grid/Graphs
Metric values in a Grid/Graph in the Group Header or Group Footer are calculated at the level of:
-
The objects on the Grid/Graph AND
-
All higher-level groups in the dataset of the Grid/Graph, not including the current group
Higher-level groups are those groups to the left of the current group. If any of the higher-level groups is set to Total, then that object is excluded from the calculations on the Grid/Graph.
For example, a document is grouped by:
-
Year
-
Region
-
Category
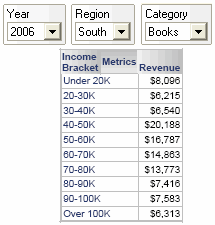
A Grid/Graph containing the Income Bracket attribute and the Revenue metric is placed in the Category Group Header section. All the groups have group totals enabled. The document is set to display the following when viewed as a PDF:
-
Year = 2006
-
Region = South
-
Category = Books
The revenue values in the Grid/Graph are calculated for the various income brackets in the South region in 2006 for books, as shown below.
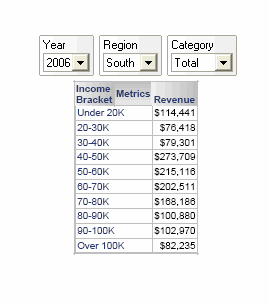
Change Category to Total. In the document sample below, the revenue amounts have increased. This is because all categories, not just books, are now included in the revenue calculation.
If you add Category to the Grid/Graph and re-execute the document, the revenue values are the same as in the previous example, and Category displays as Total in the Grid/Graph, as shown below.

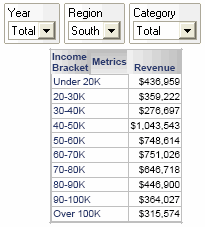
If you remove Category from the Grid/Graph and set Year to Total, the revenue values in the Grid/Graph are calculated for the various income brackets in the South region, as shown below. All years and all categories are included in the calculations. If the Grid/Graph displayed Year or Category, their page-by selections would show as Total.
If the Grid/Graph is moved from the Category Group Header to the Region Header, the metric values are calculated differently. When Region is set to All, you cannot change Category. The revenue values are calculated for the various income brackets in 2006, as shown below. All regions and all categories are included in the calculations.
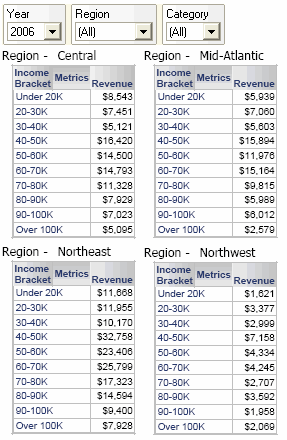
The Region has been added to help identify the different Grid/Graphs.
How group totals impact metric calculation in text fields
Metric values in a Group Header or Group Footer are calculated at the level of all higher-level groups. Higher-level groups are those groups to the left of the current group (the group creating the grouping section).
The document in this example contains text fields and metrics, and is grouped by Year, Region, and Category.
All the groups have group totals enabled. The Year Header section displays the year selected in the page-by, the Region Header section displays the region, and the Category Header displays the category and the Revenue metric. The image below shows the document in MicroStrategy Developer.
The document is set to the following for viewing as a PDF:
-
Year = 2006
-
Region = South
-
Category = All
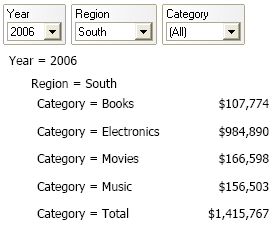
The document, as shown below, now displays the revenue for each category, as well as a total (because group totals are enabled). For the group total, the dynamic text field for Category is replaced by the word Total. For each category, the revenue is calculated for the selected year and selected region. For the category total, the revenue is calculated at the region level, for the selected year (that is, all categories for South in 2006).
If you switch Category to Total, only one line item, the category total, is displayed. The revenue includes all categories for only the South region and 2006. The total shown below is the same as the total in the previous document sample.

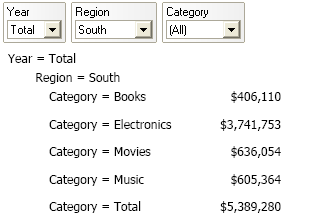
If you change Year to Total and Category to All, the revenue calculated is for the South, for all years, and for each category. The revenue amount for category total is much higher than the previous sample, because it contains all years, not just 2006.
These examples demonstrate that metric values in a Group Header or Group Footer are calculated at the level of all higher-level groups. Higher-level groups are those groups to the left of the current group (the group creating the grouping section).