Strategy ONE
Create a Dashboard Page From an Image
Starting in Strategy One (December 2025), the colors are extracted from the image to create custom palettes for the dashboard.
-
If the image is colorful, the colors are extracted and applied to the page. They are also saved as custom palettes.
-
If the image is black and white, the dashboard's default colors and formatting are applied.
Starting in Strategy One (September 2025), you can upload a picture of a dashboard and ask Auto Dashboard to make a page similar to it. The picture can be a screenshot of an existing dashboard, a sketch, or any visual representation of your desired layout. Supported image file types include:
-
HEIC (default image format from iOS)
-
JPEG
-
JPG
-
PNG
-
WebP
Starting in Strategy One (March 2026), you need the privilege listed below to see the Add Image icon. You can increase security by granting only a small group of users the new privilege.
-
Upload Images in Auto Dashboard
Create a Dashboard From an Image Using Auto Dashboard
- In Library, create a new dashboard or edit an existing dashboard.
- To edit an existing dashboard, right-click the dashboard and select Edit.
The dashboard must contain at least one dataset.
-
If the Auto Dashboard icon
 is not displayed in the sidebar, as shown below, enable Auto Dashboard.
-
If the Auto Dashboard panel is not displayed, click the Auto Dashboard icon
in the sidebar.
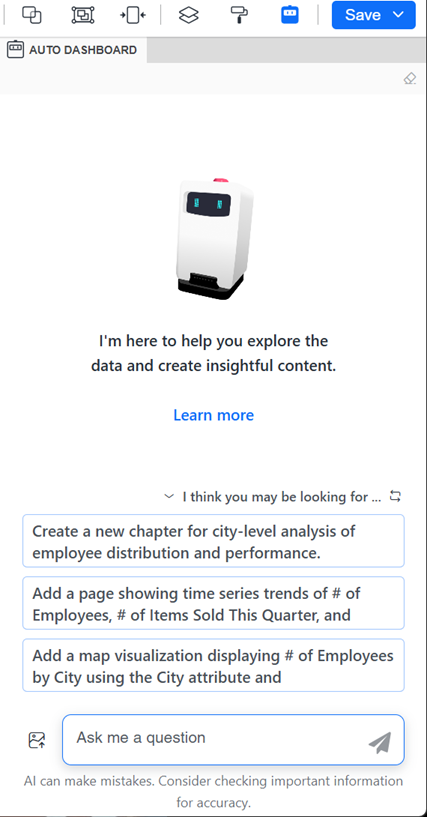
The Auto Dashboard panel displays a list of AI-generated content suggestions. The suggestions depend on the attributes and metrics in the dashboard's dataset.
-
Beginning in Strategy One (January 2026), you can display the Auto Dashboard panel as a floating window, providing more space for the dashboard canvas. Click the Switch to Floating Panel icon
 in the panel's toolbar.
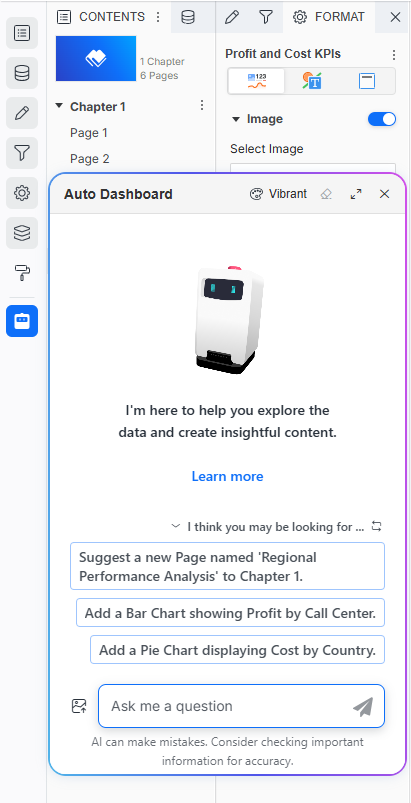 Click here for steps to work with the floating Auto Dashboard panel.
-
You can drag the floating panel to a different location on the dashboard and resize it.
-
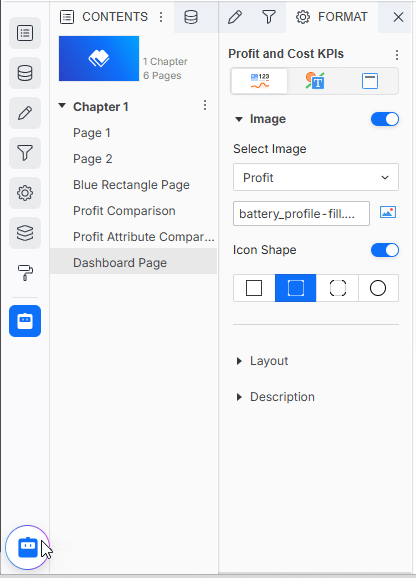
To minimize the panel to an icon at the bottom of the sidebar, click Close X. To restore it, click the icon
 .
.
-
To return the panel to the side panel, click the Switch to Side Panel icon
 in the panel's toolbar.
-
-
In the Auto Dashboard panel, click the Add Image icon
 .
. -
Navigate to and select the image to base the dashboard on. The image can be a screenshot of an existing dashboard, a sketch, or any visual representation of your desired layout.
-
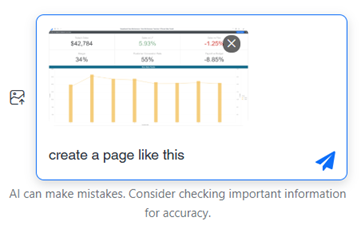
A thumbnail of the image displays in the question box with the command to "Create page from image of dashboard". Click Submit or press Enter.
For example, this image shows two rows of KPIs over a combination chart.
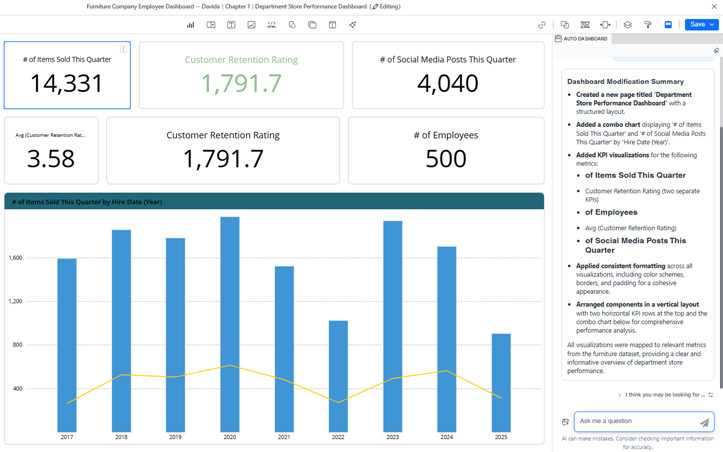
The results are shown below. A new page was created matching the image. The Auto Dashboard panel provides a summary of the changes made to the dashboard.
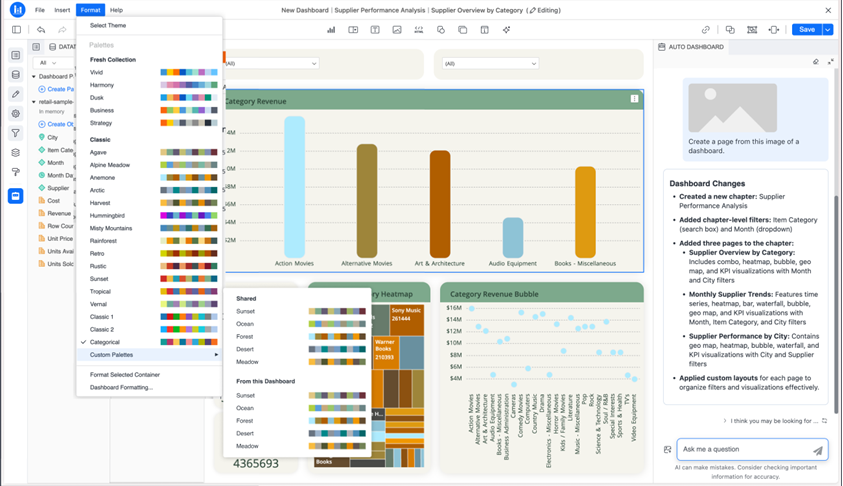
Beginning in Strategy One (December 2025), the image's colors are used to create custom palettes for the dashboard. In the example below, the color palettes extracted from the image are listed under From This Dashboard in the Format menu.
-
Edit content generated by Auto Dashboard as you would any other content.
- You can do this manually or by using Auto Dashboard. For example, Auto Dashboard can replace objects in a visualization, change the visualization type, rename objects including pages, delete visualizations or filters, and duplicate a page. For instructions to edit a visualization, see Enhance a Visualization With Auto Dashboard.
-
To generate more content using Auto Dashboard, select another suggestion or and enter a new query in the Auto Dashboard panel. If the suggestions are not listed, you can view them by expanding the I Think You May Be Looking For section. You can also:
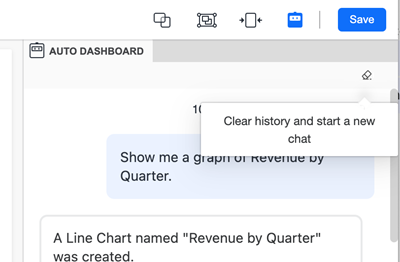
- To start a new chat without using previous responses as context, clear the conversation history. Clearing history lets you remove previous inputs so the analysis starts without bias from past sessions. Session history, especially in data-heavy dashboards, can increase load times or make Auto slower. In the Auto Dashboard panel, click Clear History
 and click Yes.
Save the Dashboard
-
Do one of the following:
-
To save the dashboard and continue editing, click Save and select Save.
-
To save the dashboard, exit editing, and view the dashboard, click Save and select Save and View.
-