Strategy ONE
Add Objects With Auto Dashboard
Strategy One (August 2025) introduces a preview feature, Auto Dashboard 2.0, which has been enhanced to improve responses and the design process. Beginning in Strategy One (September 2025), Auto Dashboard 2.0 is available out-of-the-box.
For more information on the enhancements, see Auto Dashboard 2.0 Enhancements.
Use Auto Dashboard to create and edit objects beyond visualizations on your dashboard pages:
-
Filter
-
HTML container (Strategy One (November 2025))
-
Image box (Strategy One (November 2025))
-
Shape
-
Text box
-
Rich text box (Strategy One (December 2025))
Auto Dashboard's creation and editing capabilities help you iterate quickly on your dashboard pages, allowing you to focus on insights rather than technical implementation details.
Add Objects with Auto Dashboard
- In Library, create a new dashboard or edit an existing dashboard.
- To edit an existing dashboard, right-click the dashboard and select Edit.
The dashboard must contain at least one dataset.
-
If the Auto Dashboard icon
 is not displayed in the sidebar, as shown below, enable Auto Dashboard.
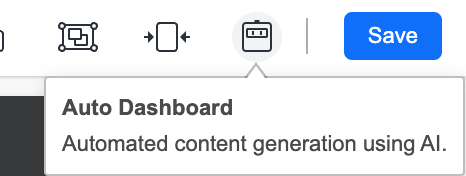
-
If the Auto Dashboard panel is not displayed, click the Auto Dashboard icon
in the sidebar.
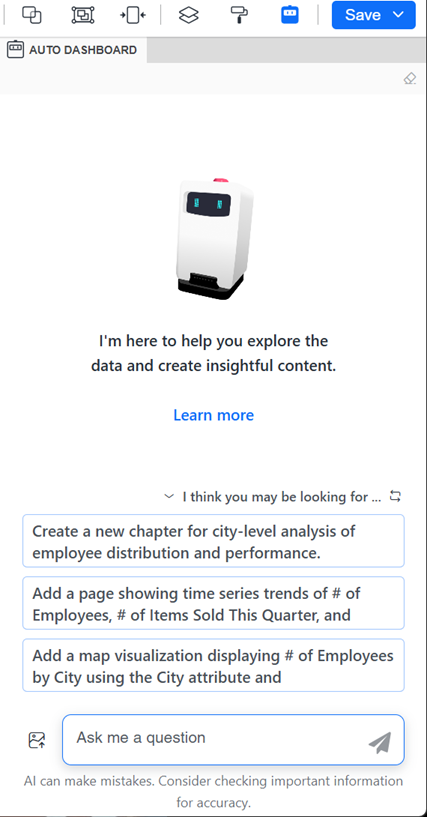
The Auto Dashboard panel displays a list of AI-generated content suggestions. The suggestions depend on the attributes and metrics in the dashboard's dataset.
-
Beginning in Strategy One (January 2026), you can display the Auto Dashboard panel as a floating window, providing more space for the dashboard canvas. Click the Switch to Floating Panel icon
 in the panel's toolbar.
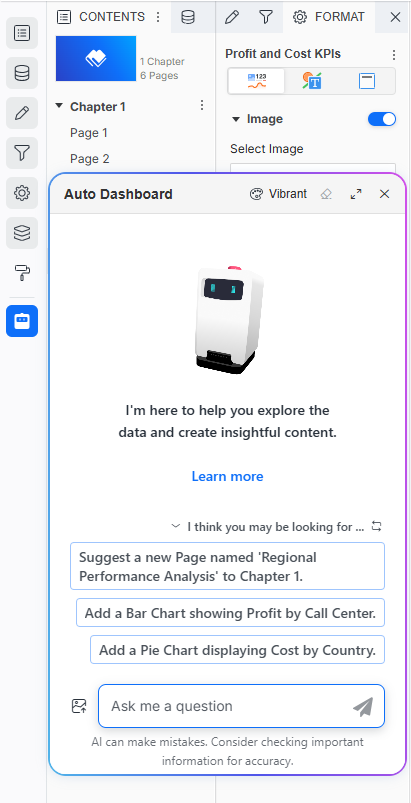 Click here for steps to work with the floating Auto Dashboard panel.
-
You can drag the floating panel to a different location on the dashboard and resize it.
-
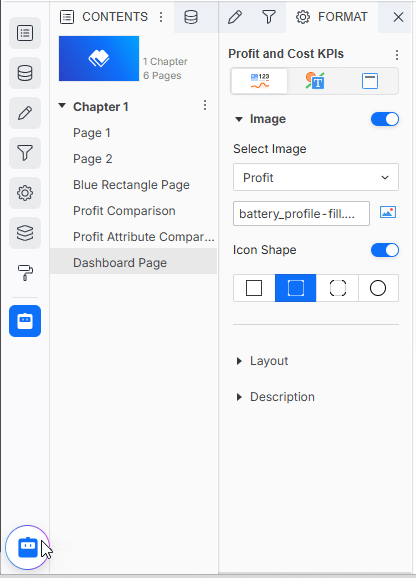
To minimize the panel to an icon at the bottom of the sidebar, click Close X. To restore it, click the icon
 .
.
-
To return the panel to the side panel, click the Switch to Side Panel icon
 in the panel's toolbar.
-
-
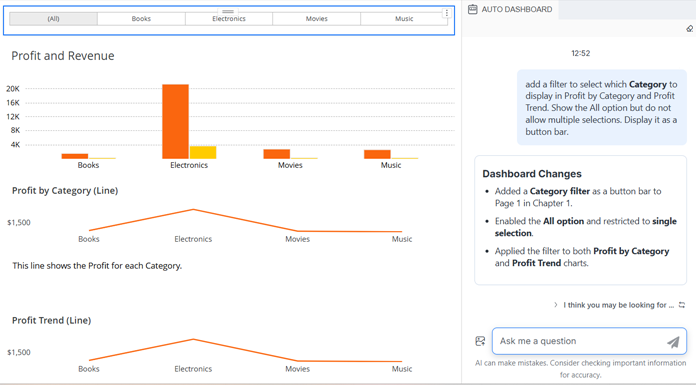
To create a filter, in the Auto Dashboard panel, type natural language instructions to describe the filter. You can:
-
Define the display style (drop-down, slider, and so on)
-
Adjust the operator for a metric filter (equals, greater than, and so on)
-
Specify which visualizations to filter
-
-
Use Auto Dashboard to display a filter's targets in the Auto Dashboard panel.
-
To create an HTML container, in the Auto Dashboard panel, type natural language instructions to describe the HTML container.
-
To create an image container, in the Auto Dashboard panel, type natural language instructions to describe the image, including the path to the image.
-
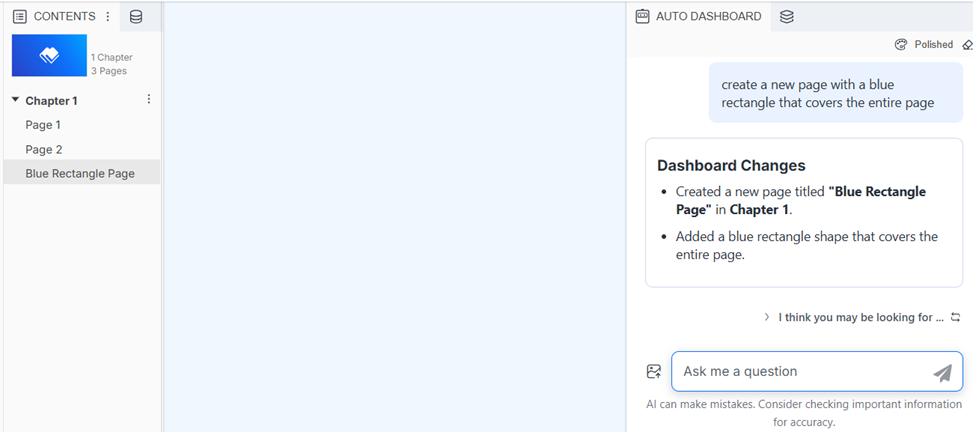
To create a shape, in the Auto Dashboard panel, type natural language instructions to describe the shape. You can:
-
Indicate what type of shape (rectangle, circle, and so on)
-
Size the shape
-
-
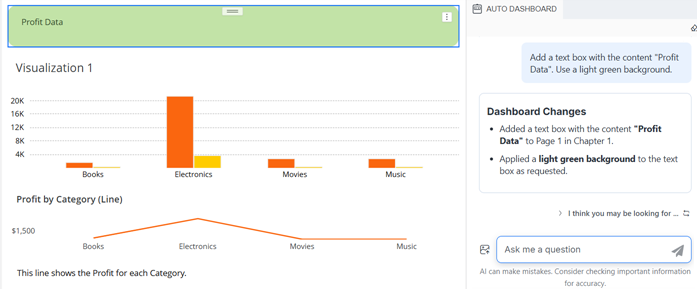
To create a text box, in the Auto Dashboard panel, type natural language instructions to describe the text box. You can:
-
Describe the text to display
-
Customize the background color of the text box
-
-
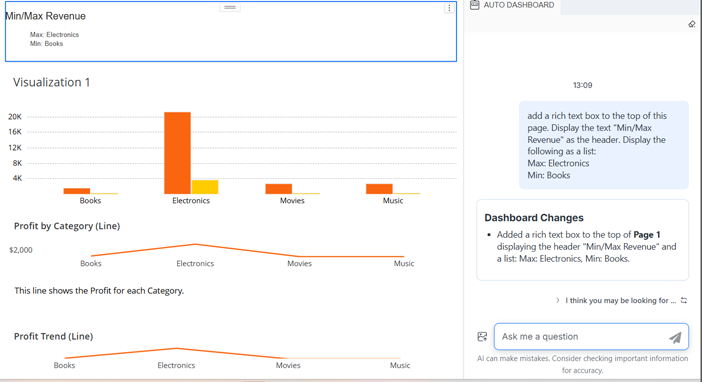
To create a rich text box, in the Auto Dashboard panel, type natural language instructions to describe the text box. You can:
-
Describe the text to display
-
Describe the format to use, such as headers, bold, and lists
-
-
Use Auto Dashboard to rewrite, replace, remove, or add text in a text field or rich text field.
-
Use Auto Dashboard to:
-
Move, align, and resize objects
-
Delete objects
-
Rename objects
-
-
Use Auto Dashboard to change an object's background color.
-
You can ask Auto Dashboard for ideas on what you can do. For example, type, "What can I can do with a filter?".
Save the Dashboard
-
Do one of the following:
-
To save the dashboard and continue editing, click Save and select Save.
-
To save the dashboard, exit editing, and view the dashboard, click Save and select Save and View.
-