Strategy One
Create and View Objects in the Tables View
The table mapping view facilitates clear and efficient attribute and metric mapping across tables. It features interactive diagrams to display relationships, drag-and-drop mapping capabilities, and real-time validation, to help you define and visualize how tables connect and interact with their Mosaic model.
Access the Tables View
-
Open a Mosaic model.
-
In Prep and Model, click Tables.
-
To change the layout, drag and drop tables and resize tables.
-
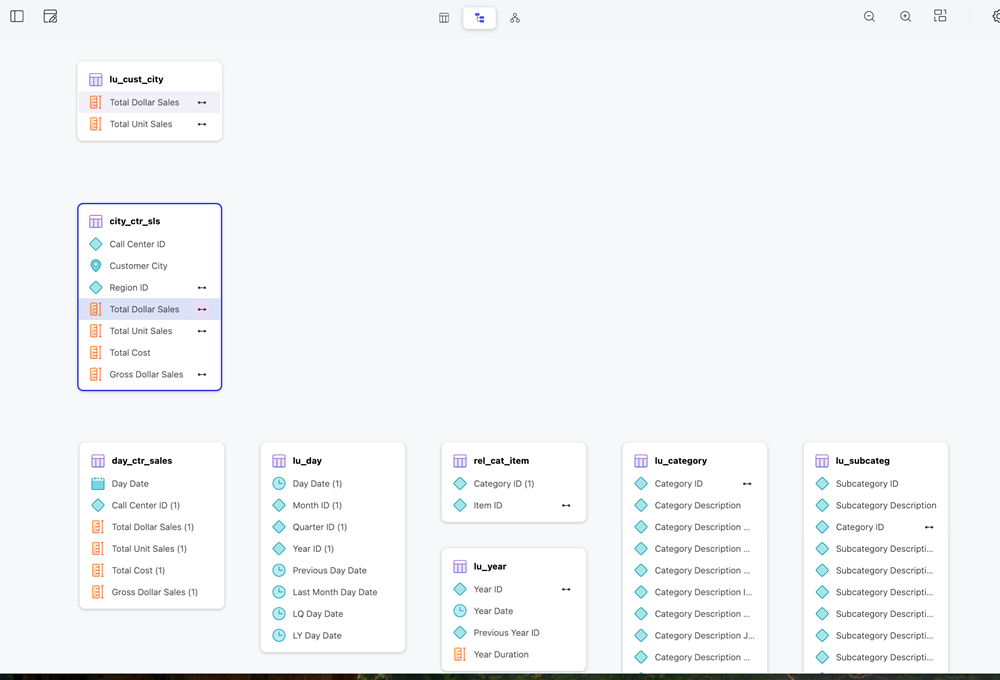
View the map view legend in the bottom right of the Map View.
Table colors represent different data types:
-
Gray: The table is in the AI generation workflow.
-
Green: There is no column metric in the table.
-
Orange: There are column metrics in the table.
-
Link Tables
To display aggregation paths for attributes in a table, hover over the table name and click Show Aggregation Paths.
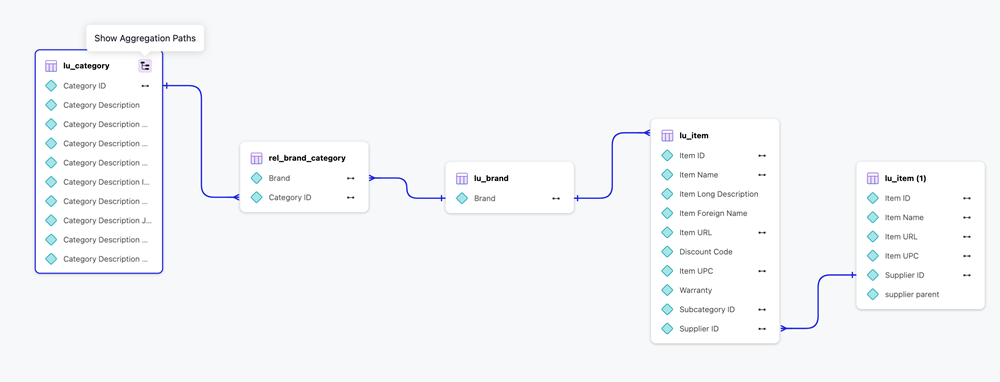
When you click on a table, performing the following for each attribute, depending on your data infrastructure:
If the Table is the Lookup Table for the Attribute
-
Find all relationships where the attribute is the child attribute.
-
Connect the table to each related relationship.
You can skip this step if the table is also the relationship table.
-
For each relationship table, connect the parent attribute on the relationship table to its own lookup table.
-
Repeat these steps for all parent attributes until all tables are connected.
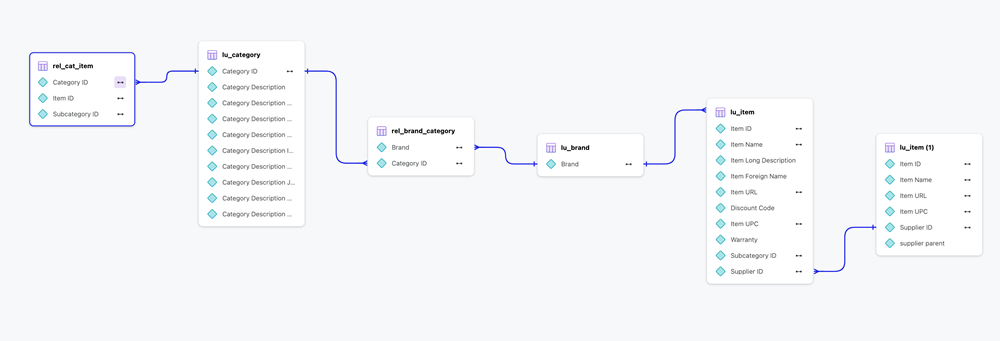
If the Table is a Relationship Table for the Attribute
-
If the attribute is a child attribute in the relationship, connect the attribute to its lookup table.
-
If the attribute is the parent attribute in the relationship, connect the attribute to its lookup and connect all ancestor tables by linking relationship tables and lookup tables.
If the Table is Neither a Lookup Table Or a Relationship Table for the Attribute
-
Connect the attribute to the lookup table.
-
From the attribute lookup table, connect all ancestor tables by linking relationship tables and lookup tables.
Link Attributes
Linked attributes display with a link icon. Click the attribute link to display that attribute's related tables.
If the current table is not a relationship table, all tables containing the selected attribute will connect to its lookup tables.
Link Metrics
If you click a metric link, the Map View will move tables closer together and highlight the metric in its tables.
Context Menu
Right-click a table name, attribute, column metrics, or columns to trigger a context menu that varies depending on the object.
Table
-
Rename
-
Duplicate
-
Delete
Attribute
-
Edit
-
Rename
-
Duplicate
-
Set as Lookup Table: Set the current table as a lookup table
-
Unmap from: Unmap the attribute from the current table
-
Merge to: If the source attribute and target attribute are in the same table, create a multi-form attribute. If the source attribute and target attribute are in different tables, link the attributes.
-
Define Geography: Define geography for the key form such as Country, State, and more.
-
Convert to Column Metric: Convert the attribute's form to a metric. Group forms are not supported.
-
Delete
Column Metric
-
Rename
-
Duplicate
-
Unmap
-
Convert to attribute: Convert all column expressions to attribute key form expressions.
-
Delete
Columns
To display attribute forms or unmapped columns, click Panel Options  in the left pane and choose Show Attribute Forms or Show unmapped columns.
Interact with Other Panels
Interact with the Objects Panel
Use the Objects panel to perform the following actions:
-
Search an object and click it in the Objects panel. The Tables view highlights and centralizes the selected attribute.
-
Click a table in the Objects panel and the Tables view centralizes the selected table.
-
Double-click a table to open the Preview panel and view table details.
Interact with the Preview Panel
Perform one of the following actions to access the Preview panel.
-
Right-click an attribute or column metric and click Edit to view details in the Preview panel.
-
Double-click a table name to view details in the Preview panel.
Toolbar
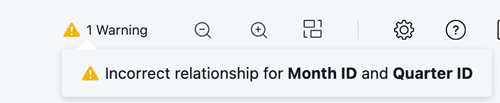
Use the toolbar in the top right for the following functions:
-
Warning
 : Displays the number of invalid relationships. Hover over this icon to view the list of warnings.
 -
Auto Layout
 : Displays tables in auto layout hybrid view.
 -
Scale
 : Adjusts the canvas zoom level.