Strategy One
Create and Edit Base and Advanced Metrics in Mosaic Studio
Starting in Strategy One (December 2025), use the Sensitivity option to define metric sensitivity and monitor it in Mosaic Sentinel.
Mosaic Studio includes two types of metrics, basic metrics and advanced metrics. Basic metrics are metrics gathered from your initial import or you can create a base metric by converting an attribute. Use one or more base metrics to create a new advanced metric that fits your business needs.
See the following topics:
Create a Base Metric
-
In the Objects panel, right-click a table and click Create Base Metric
or
Right-click an attribute and click Convert to Base Metric.
-
If you click Create Base Metric, enter or select values in the following fields:
Name Click the metric name and type a new value.
Aggregation Expand the drop-down list and choose how the data will be aggregated when the metric is calculated.
Data Type Expand the drop-down list and choose the kind of data values the metric will return.
Description Type an optional description of the metric.
Expressions Type or double-click options from the right panel to create a formula and click Save.
Formatting
Category Expand the drop-down list and choose the kind of data the metric represents. Add values to the following fields, depending on your Category:
Decimal Places Click how many decimal places to decrease or increase.
Use 1000 Separator Select this check box to include a comma in values that exceed 1000.
Negative Numbers Expand the drop-down list and choose how to display negative numbers.
Format Expand the drop-down list and choose a format for specialized data types.
Options
Alias Type a column alias name to use in SQL statements when running reports or visualizations against the underlying data source.
Sensitivity Starting in Strategy One (December 2025), expand the drop-down list and define your metric sensitivity to monitor it in Mosaic Sentinel.
Set as HTML content Toggle on this option to enable the metric to be used for custom HTML and JavaScript content when displayed in grids, dashboards, or reports.
Enable non-aggregation behavior Toggle on this option to keep the first/last value for this attribute only. If toggled on, define the following fields:
Attribute Expand the drop-down list and choose an attribute to base the behavior on.
Calculation Choose whether the calculation is based on the Beginning or Ending behavior.
Source Choose whether the behavior is sourced from the fact or attribute lookup table.
-
Click Save.
Edit a Base Metric
-
In the Objects panel, right-click a base metric and choose Edit.
-
Enter or select values in the following fields:
-
Click Save.
Name Click the metric name and type a new value.
Aggregation Expand the drop-down list and choose how the data will be aggregated when the metric is calculated.
Data Type Expand the drop-down list and choose the kind of data values the metric will return.
Description Type an optional description of the metric.
Expressions Type or double-click options from the right panel to create a formula and click Save.
Formatting
Category Expand the drop-down list and choose the kind of data the metric represents. Add values to the following fields, depending on your Category:
Decimal Places Click how many decimal places to decrease or increase.
Use 1000 Separator Select this check box to include a comma in values that exceed 1000.
Negative Numbers Expand the drop-down list and choose how to display negative numbers.
Format Expand the drop-down list and choose a format for specialized data types.
Options
Alias Type a column alias name to use in SQL statements when running reports or visualizations against the underlying data source.
Sensitivity Starting in Strategy One (December 2025), expand the drop-down list and define your metric sensitivity to monitor it in Mosaic Sentinel.
Set as HTML content Toggle on this option to enable the metric to be used for custom HTML and JavaScript content when displayed in grids, dashboards, or reports.
Enable non-aggregation behavior Toggle on this option to keep the first/last value for this attribute only. If toggled on, define the following fields:
Attribute Expand the drop-down list and choose an attribute to base the behavior on.
Calculation Choose whether the calculation is based on the Beginning or Ending behavior.
Source Choose whether the behavior is sourced from the fact or attribute lookup table.
Create an Advanced Metric
-
Click Create Metric.
-
Click the metric name, type a new name, and press
Enter. -
Choose a data type for the advanced metric in the Data Type drop-down list.
-
Type a Description for the metric.
-
Expand the Functions pane to search for and select a function.
-
To locate a function, type its name in the Search box.
-
You can also browse for a function by selecting a function category (such as Basic Functions or String Functions) from the drop-down list.
-
-
Use the Formula pane to define the expression for the advanced metric.
-
Define the metric's formula, which consists of arithmetic operators (+, -, *, and /) and functions. The operators and functions can be applied to attributes or metrics.
-
An example of a compound metric formula is RunningAvg(Cost), where Cost is a metric and RunningAvg is a function that calculates the running average.
-
Another example is Sum(Cost) + Sum(Profit), where Cost and Profit are metrics and Sum is a function that calculates the sum. In this case, the sum of the Cost metric is added to the sum of the Profit metric.
You can also use Auto Metric to help you create your advanced metric. For more information, see Auto Metric.
-
-
Click Validate to ensure the expression is correct.
-
If the expression is incorrect, a suggestion displays in Auto Metric. Click Update or Copy under the expression.
If the proposed metric does not meet your needs, type a follow up message including generic metric related questions or questions specific to your metric. For example, "What's a level metric?" and "Add a level with Country.".
-
Click Save.
Edit an Advanced Metric
-
In the Objects panel, right-click an advanced metric and choose Edit.
An explanation of the metric displays in Auto Metric.
-
To change the metric name, click the metric name, type a new name, and press
Enter. -
To edit the formula, type your changes in the Formula pane.
-
To edit the metric category, click Formatting.
-
To define metric properties such as an alias, pushdown behavior, joins, and to set as HTML content, click Options.
Attribute and Metric Default Icons
You can use auto-semantic-role-detection for attributes (for example, Person, Geo, Time/Date, Email, Phone Number) and fact metrics (for example, currencies, percentages). A Mosaic model built using detection can provide more context in subsequent data analysis to assist in achieving more accuracy. Detected roles will display special icons in your Mosaic model and wherever your Mosaic model is supported.
Supported Roles
The following roles are supported and are assigned their own icons. Roles that include numbers are formatted automatically.
-
Time dimension: Date, Time, Datetime, Year, Quarter, Month, and Weekday
-
Geo dimension: Country, State, City, Location, Country, Area code, Zip code, Latitude, and Longitude
-
Person: Person, Name, Age, Gender, Birthday, Education, and Title
-
Number: Fix, Currency, Percentage, Faction, and Scientific
-
Others: Email, Phone number, and Url
Role Detection
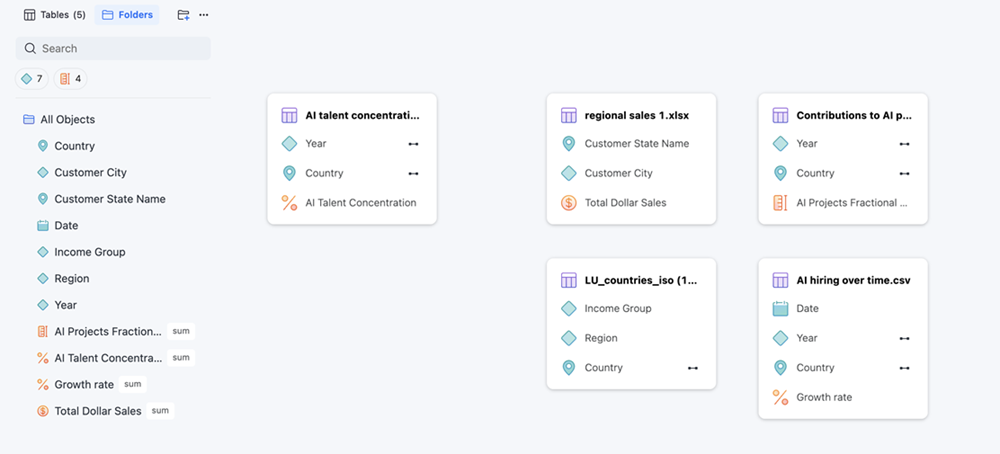
Imported tables that contain supported role information will automatically link to relevant attributes and fact metrics. You can identify which objects have roles by their icons.
Year, Quarter, Month, Weekday, Fixed, Faction, and Scientific roles do not have icons. Fixed, Faction, and Scientific roles' format will be automatically updated.
For example, if your data is imported using a csv file, the following roles will be identified and assigned the associated icon:
-
Country_IDandalpha-2is detected asGEO.Country Role -
Yearis detected asTIME.Year Role -
Dateis detected asTIME.Date Role -
Growth rateis detected asNUMBER.Percentage Role