Strategy One
Quick Thresholds Editor
Use the Quick Thresholds Editor to apply specific formatting to data that meets certain conditions. This conditional formatting is called a threshold. Data that is formatted differently calls attention to itself, and makes that data easier to locate for analysis. You can
A quick threshold is based on a single metric condition and formats bands of metric values with color or images. In contrast, an advanced threshold can be based on multiple attribute and metric conditions and formats attribute or metric values. The formatting options of an advanced metric are more complex, including replacing the data values with different text or an image, changing the font style and color of the values, and defining a border around the cells.
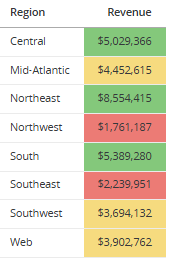
A report displays revenue data for different geographical regions. Use thresholds to display revenue values less than $3,500,000 in red, greater than $5,000,000 in green, and the rest in yellow. You can do the same in a grid visualization on a dashboard, as shown in the image below.
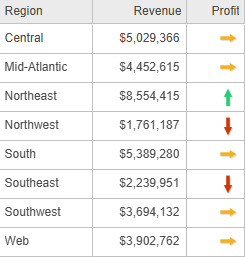
You could instead replace the metric values with arrows, as shown in the report example below. The Profit values are replaced with red arrows for values less than $500,000, green arrows for greater than $1,000,000, and yellow arrows for the middle.
Prerequisites
Your dashboard must contain one of the following:
- A grid visualization with a metric in the Metrics area of the Editor panel.
- A network visualization with a metric in the Edge Color area of the Editor panel.
- A graph, heat map, or map visualization with a metric in the Color By area of the Editor panel.
Your report must display a metric.
Access
To access the Quick Thresholds Editor:
-
While editing a dashboard:
- Click the visualization to add a threshold to.
- In the Editor panel, right-click the metric to apply the threshold to and choose Thresholds. This is the same metric defined in the Prerequisites section above.
- While editing a report:
- In the Editor panel, right-click the metric to apply the threshold to and choose Thresholds.
If the metric already contains a threshold, the option is named Edit Thresholds.
The selected metric is replaced by the image or displays in the defined colors. You can also define the threshold's condition on a different metric. For instance, you can color the Revenue metric values based on Profit values.
Fields
-
Thresholds Type: Select one of the following:
-
To create a threshold that changes the color used to display metric values, select Color-based.
-
To create a threshold that replaces metric values with an image, select Image-based. In a dashboard, this option is available only if the selected visualization supports replacing metric values with images, such as grids and maps. This option is always available for a report.
-
-
Color: Available for a color-based threshold. Select a color scheme to apply to the metric values. Click Reversed
 to reverse the order of the colors displaying data within the range.
 -
Images: Available for an image-based threshold. Select an image scheme to apply to the metric values. Click Reversed
to reverse the order of images displaying data within the range. -
Based on: The first drop-down list contains all the metrics in the dashboard or report. Select the metric to use in the threshold condition. From the second drop-down list, select the condition:
- Value: Creates a threshold based on the value of the metric.
- Lowest: Creates a threshold based on the bottom n metric values.
- Highest: Creates a threshold based on the top n metric values.
- Lowest %: Creates a threshold based on the bottom n percent of metric values.
- Highest %: Creates a threshold based on the top n percent of metric values.
-
Break By: Available for rank- and percent-based thresholds. Select the attribute level to restart counting rank or percent values for the metric. To continue counting without restarting, select None.
-
Allow Users to Show and Hide All Thresholds: Select this check box to allow users viewing the report or dashboard in Library to hide and display all the thresholds defined in the report or dashboard.
-
Threshold Slider: Each band that displays in the threshold slider represents a different range of metric values. The band's color or the image that displays above the band represents the formatting for displaying values that fall within its range.
-
You can modify the range covered by a band:
- To increase or decrease the range of values covered by the band, click and drag a thumb
 left or right along the threshold slider.
 - To change the end of a band to a specific value, click the thumb at the end of the band, type the new value in the box, and press the Enter key.
- To increase or decrease the range of values covered by the band, click and drag a thumb
-
You can add or edit bands for thresholds that use colors rather than images:
- To change the color applied to the range of values covered by a band, double-click the band, then select the new color from the palette.
- To create a new band, right-click the band to divide and select Add Color Band. You can change the range of the band, as described above.
- To delete a band, right-click the band and select Delete.
- To delete a thumb, click the thumb and select Delete.
-
-
Advanced Thresholds Editor: Click to open the Advanced Thresholds Editor to create multiple conditions for a single threshold, create attribute conditions, apply thresholds to attributes, and define more complex formatting such as replacing the data values with different text or an image, changing the font style and color, and selecting a border.
-
If a quick threshold has already been defined, you choose whether to Clear the existing thresholds or Apply them, which means that they remain on the grid and you can edit them in the Advanced Thresholds Editor.
-
Related Topics
Create a Threshold on a Metric Using the Quick Thresholds Editor (for a visualization in a dashboard)