Strategy One
Advanced Thresholds Editor
Use the Advanced Thresholds Editor to format attribute and metric values based on one or more attribute and metric conditions. This conditional formatting is called a threshold. Data that is formatted differently calls attention to itself, making that data easier to locate for analysis.
Advanced thresholds use more complex formatting such as replacing the data values with different text or an image, changing the font style and color of the values, and defining a border around the cells.
Use Quick Thresholds to create thresholds based on single metric conditions that format bands of metric values with color or images.
Your company assesses employees using both the Employee Rating and Average Customer Satisfaction metrics. The grid shown below categorizes employees according to these criteria. For example, Sam Matthews is assessed as a top employee, so his name displays in larger green font on a gold background. In contrast, Tareiq Holmes-Dennis, who falls in the lowest ranking, displays in white font on a red background.
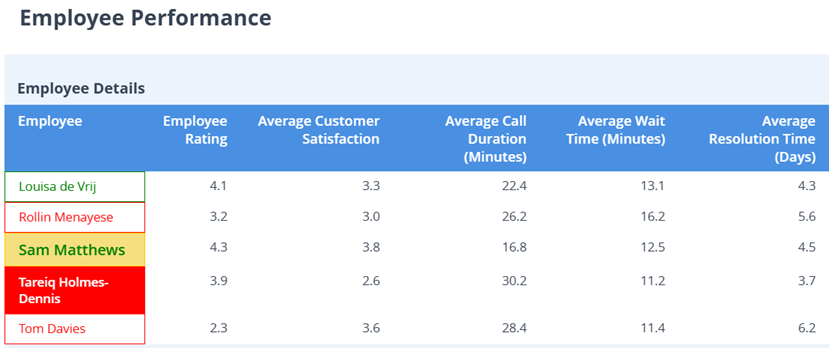
A top employee has an employee rating of 4 or higher and customer satisfaction greater than 3.5. The criteria for middle ranges are more complex, involving multiple assessments. For example, the second range is defined as either of the following:
-
Employee rating of 4 or higher and customer satisfaction between 3 and 3.5
-
Employee rating between 3 and 3.0 and customer satisfaction between 3.6 and 3.9.
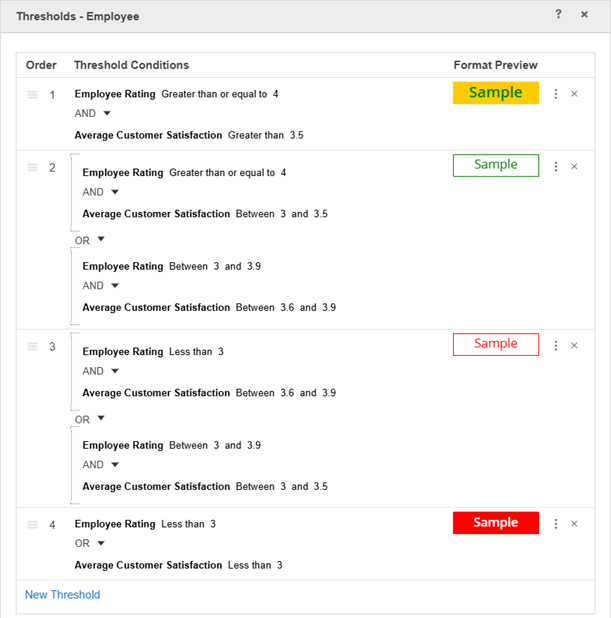
The definitions for all the evaluation ranges are shown below in the Thresholds dialog box:
Use advanced thresholds rather than quick thresholds to create this scenario, because:
-
The thresholds apply to an attribute, Employee. Quick thresholds apply to metrics, while an advanced threshold applies to an attribute or a metric.
-
Each threshold contains multiple conditions, that is, evaluating both Employee Rating and Average Customer Satisfaction scores. A quick threshold contains a single condition.
-
The threshold formatting not only changes cell backgrounds, like quick thresholds do, but also alters the font color and size and applies a border.
Prerequisites
Advanced thresholds are available for reports and dashboards. The dashboard must contain a grid visualization with a metric in the Metrics area or an attribute in the Rows or Columns area.
Access
To access the Advanced Thresholds Editor:
-
While editing a dashboard:
- Click the visualization to add a threshold to.
- In the Editor panel, right-click the attribute or metric to apply the threshold to and choose Thresholds.
- If you selected a metric, the Quick Thresholds Editor opens. Click Advanced Thresholds Editor.
- If a quick threshold has already been defined, you choose whether to Clear the existing thresholds or Apply them, which means that they remain on the grid and you can edit them in the Advanced Thresholds Editor.
- While editing a report:
- In the Editor panel, right-click the metric to define a threshold on and choose Thresholds.
- If you selected a metric, the Quick Thresholds Editor opens. Click Advanced Thresholds Editor.
- If a quick threshold has already been defined, you choose whether to Clear the existing thresholds or Apply them, which means that they remain on the grid and you can edit them in the Advanced Thresholds Editor.
If the metric already contains a threshold, the option is named Edit Thresholds.
The selected object displays with the formatting defined in the threshold. You can also define the threshold's condition on a different object. For instance, you can color the Revenue metric values based on Profit values.
Fields
-
New Threshold: Adds a new threshold. Define the condition (such as Revenue greater than $1 million or Category = Books) that data must meet to display the threshold format.
After you create the first threshold, the following fields display:
-
Order: Indicates the order in which the system evaluates a threshold. Click and drag a threshold to reorder it.
-
Threshold Conditions: Displays the threshold conditions. Select a threshold condition to edit it.
- Add Condition: Adds a new condition to this threshold. The conditions are evaluated together to determine whether to apply the threshold format. Hover over an existing condition to display this option.
- Operator: By default, multiple conditions in the same threshold are joined with AND. You can select a different operator (OR, AND NOT, and OR NOT) from the drop-down list. The operator displays when the threshold contains multiple conditions.
- Group Conditions: Groups conditions together. For example, your threshold needs to display when either the Category is Books or when the Category is Music with a Revenue greater than $1 million. This option displays when the threshold contains at least three conditions. Hover over the operator between conditions to display this option.
-
Format Preview: Previews the display of data that meets the threshold's condition. Click the preview to select formatting options for the condition. Click More
 to perform the following actions:
- Apply to: Select the areas to format.
- For a metric, the format can apply to the Metric Only, Subtotals Only, or Metrics and Subtotals that meet the threshold conditions.
- For an attribute, the format can apply to the Element Rows Only, Subtotals Rows Only, or Elements and Subtotals that meet the threshold conditions.
- Formatting: Format the values that meet the threshold's condition:
Replace Data: Select the Enable Data Replace check box to replace the data that meets the threshold condition. From the drop-down list, select the replacement: text, symbol, or image.
Click here for further instructions.If you select Replace Text, type the replacement text in the box.
If you select Quick Symbol, select the symbol from the drop-down list.
If you select Replace With Image, type the image URL in the box. Starting in Strategy One (March 2025), you can type a description of the image in the Alternative Text box. The description is used by screen readers or other assistive technology, improving the dashboard's accessibility.
- Font: Select font formatting options including style, size, and color to apply to the data values.
- Color and Border: Select the cell's fill color and opacity. Define the style and color of the border that displays around the cell.
- Duplicate: Adds a copy of the current threshold to the end of the list. You can then edit the threshold's conditions and format as needed.
- Move Up/Move Down: Change the order in which the system evaluates a condition within the threshold by moving it up or down in the list.
- New Condition: Adds a new condition to the threshold. Define the condition (such as Revenue greater than $1 million or Category = Books) that data must meet to display the threshold format.
- Apply to: Select the areas to format.
-
Allow Users to Show and Hide All Thresholds: Select this check box to allow users viewing the report or dashboard in Library to hide and display all the thresholds defined in the report or dashboard.
-
Quick Thresholds Editor: Click to open the Quick Thresholds Editor. Any thresholds that you defined are cleared. If you do not want to clear them, click Cancel to return to the Advanced Thresholds Editor.
Related Topics for Creating Thresholds in Dashboard Visualizations
Create a Threshold on an Attribute or Metric in the Advanced Thresholds Editor
Format a Threshold on an Attribute or Metric in the Advanced Thresholds Editor
Add Multiple Conditions to a Threshold in the Advanced Thresholds Editor
Group and Combine Threshold Conditions in the Advanced Thresholds Editor
Edit, Duplicate, Rearrange, and Delete Thresholds in the Advanced Thresholds Editor