Strategy One
Introduction to Map Visualizations with Density Areas
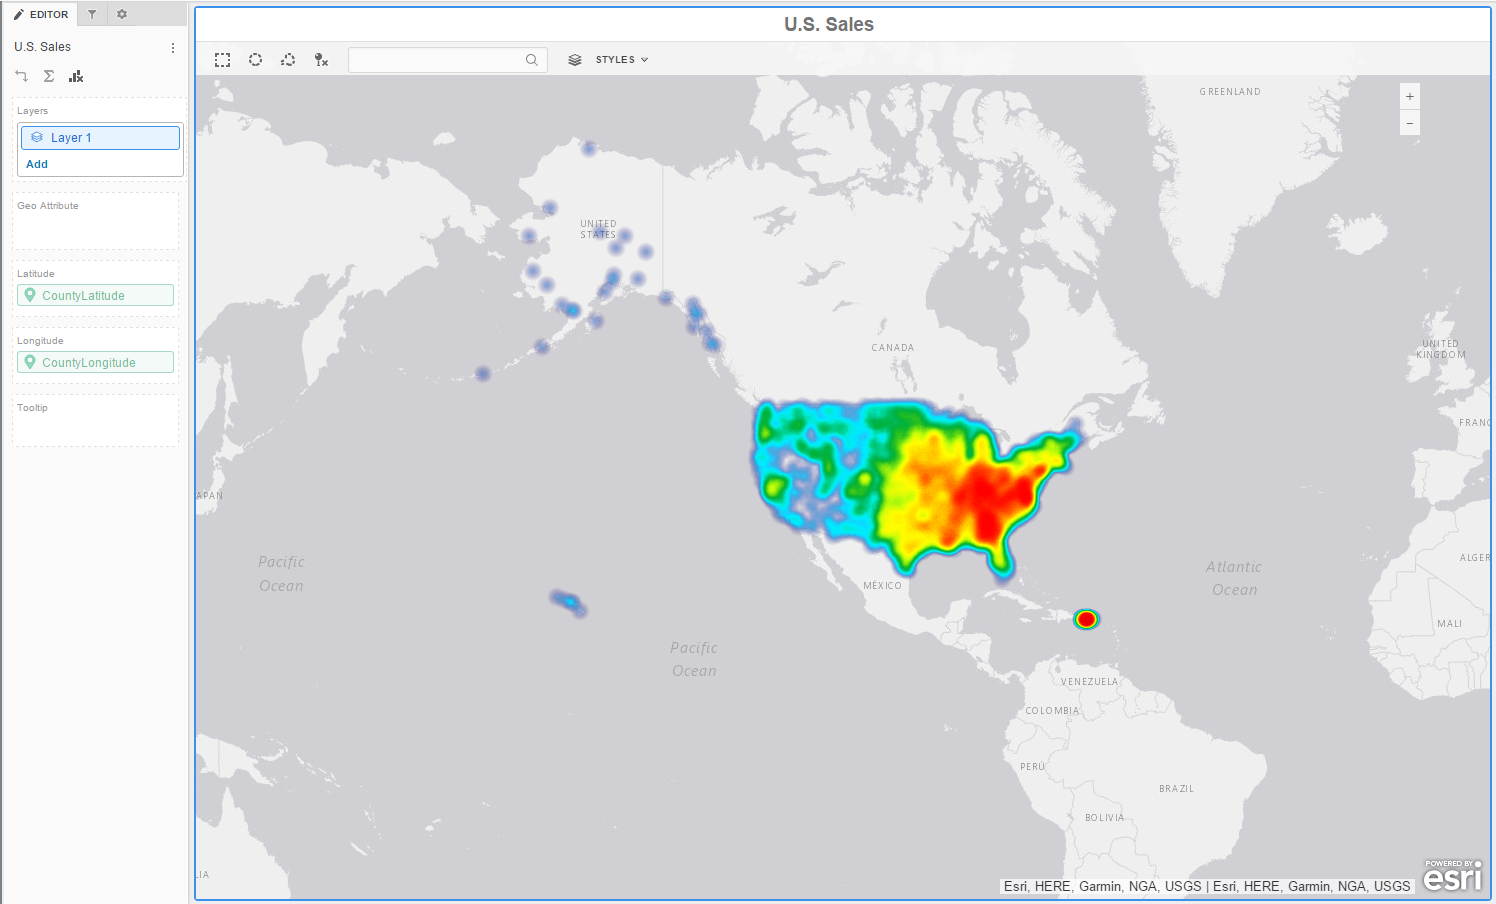
You can display locations in a map visualization using a density map. Density maps allow you to visualize patterns and trends for several geographic locations by using color gradients based on the concentration of geographic data.
Density areas are available for ESRI and Google maps.
Display locations with a high concentration of stores in red, and locations with a low concentration of stores in blue.
You can perform the following tasks using a density map:
- View different types of maps, such as topographical or satellite.
- Customize the color theme for displaying areas in the map.
- View additional information by adding tooltips. You can display tooltips by hovering over density areas in the map.
Related Topics
Introduction to Map Visualizations
Create a Map Visualization with Density Areas
How to Add, Reorder, Rename, and Remove Map Layers