Strategy ONE
Graph Type: Radar
In the Graph Type dialog box you can select one of the following layouts for the Radar chart:
-
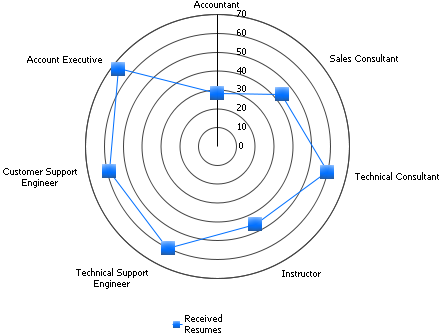
Line: The data markers are plotted on rings surrounding the center of the graph, like rings in a tree trunk. The higher the value for each data marker, the further it is from the center. The data markers are connected with a line drawn around the center point. The image below shows an example of a Radar Line graph.
-
Stacked Line: Stacks line risers on top of each other. The axis is the cumulative total of all the groups.
-
Dual Axis Line: For Radar Line graphs, makes a graph with two numeric axes. This allows you to chart some of the series on one axis and some of the series on another axis.
-
Dual Axis Stacked Line: For Stacked Line graphs, makes a graph with two numeric axes and stacks line risers on top of each other. This allows you to chart some of the series on one axis and some of the series on another axis.
-
Area: Emphasizes the magnitude of change over time. By displaying the sum of the plotted values, an area graph also shows the relationship of parts to a whole.
-
Stacked Area: Stacks area risers on top of each other. The axis is the cumulative total of all the groups.
-
Dual Axis Area: For Radar Area graphs, makes a graph with two numeric axes. This allows you to chart some of the series on one axis and some of the series on another axis.
-
Dual Axis Stacked Area: For Stacked Area graphs, makes a graph with two numeric axes and stacks area risers on top of each other. This allows you to chart some of the series on one axis and some of the series on another axis.
When you select a subtype in the dialog box, an example appears in the lower window. Click OK to apply the selected graph type to your report data.
Related topics