Strategy One
Document Editor: Dataset Objects
If you arrived here from Workstation, see the Workstation Document Authoring Help.
The Dataset Objects panel contains all of the items that can be placed on the document, organized by dataset. For example, if you add the Profit by Project Category report as a dataset to the document, as shown in the image below, all attributes, metrics, custom groups, and consolidations in the report are listed under the report's name in the Dataset Objects panel. You can drag and drop items from the list to add them to the document.
The following can be used as datasets in documents:
- Reports, including Freeform SQL reports, Query Builder reports, MDX cube reports, and reports that access Intelligent Cubes.
- Intelligent Cubes. An Intelligent Cube can be based on Strategy project data or imported data.
- Data imported directly into the document from an external data source.
You can access the Dataset Objects panel by selecting Dataset Objects from the Tools menu. It is located on the left side of the Document Editor interface.

To add a dataset to the document, click the Add
Dataset icon  . The Select
Dataset dialog box opens, allowing you to select an existing dataset
or import data. When you return to the Document Editor, the dataset is
added and displayed in the Dataset Objects panel.
To remove a dataset from the document, click the name of the dataset
that you want to remove, then click the Delete
icon  . Click OK.
The dataset is removed.
You can drag and drop items from the Dataset Objects panel onto the Layout area to add them to the document. This creates text fields in the Layout area. You can create a grid from a dataset report by dragging and dropping the name of the dataset report from the Dataset Objects panel to the Layout area. You can then determine if the dataset report is displayed in Grid, Graph, or Grid and Graph view by right-clicking the dataset grid, pointing to View Mode, and selecting the appropriate option.
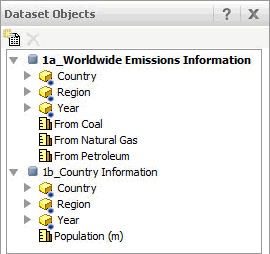
The Dataset Objects panel first displays the name of each dataset in the document, then lists the objects used in it. If multiple datasets are included on the document, the name of the grouping and sorting dataset is displayed with bold text. Any attribute used in multiple imported datasets is displayed with a blue indicator. In the example below, Worldwide Emissions Information is the grouping and sorting dataset (indicated by the bolded dataset name), and the Country, Region, and Year attributes are used in both imported datasets (designated by the blue indicator).

You can link imported data to project attributes. For steps, see About linking imported data to project attributes.
For background information on datasets, including how multiple datasets are joined and the impact of deleting datasets, see the Adding Text and Data chapter of the Document Creation Help.
Related Topics
Document Editor: Document Structure
