Strategy ONE
Drilling in Grid/Graphs
Drilling on a Grid/Graph in a document is similar to drilling on a report. Drilling allows users to look at specific data at levels other than that of the originally displayed Grid/Graph. It allows users to retrieve more information after the document has been executed. The new data is obtained by requerying the database at a different attribute or fact level. For an introduction to drilling, see the Basic Reporting Guide.
Before a user can drill on a Grid/Graph in a document, you must enable drilling for the Grid/Graph. Steps to enable or disable drilling for a Grid/Graph are below.
When you enable drilling, you can define whether users can only drill within the dataset or drill anywhere. You can also define whether subtotals on the parent report are also displayed on the drilled-to report. And you can define the join type of the drill attributes to determine how the data is calculated on the drilled-to report. For details on these two options, see Inheriting subtotals and defining join type.
For information on how drilling works with links and selectors in Grid/Graphs, see How links, drilling, and selectors work together.
Drill maps determine what happens when an object is drilled on. You can create and edit the drill maps for a Grid/Graph. For more information on drill maps, see the Advanced Reporting Guide.
You can determine drilling behavior by clicking Preferences at the top of any page in MicroStrategy Web, then clicking Drill mode on the left. You can set such preferences as whether the drilled-to report/document opens in a new window or replaces the drilled-from report/document in the old window. For details on all options, click Help.
To enable or disable drilling in a Grid/Graph
-
In MicroStrategy Web, open the document in Design or Editable Mode.
-
Right-click the Grid/Graph and select Properties and Formatting. The Properties and Formatting dialog box opens.
-
From the left, select Grid.
-
In the Drilling area, select one of the following from the Drill options drop-down list:
-
To disable drilling, select No drilling.
-
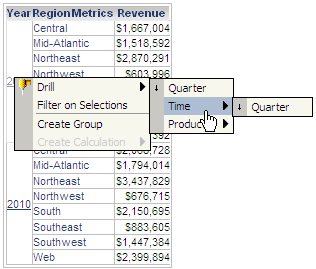
To allow users to only drill using objects that are within the dataset, select Drill within. Only the drill paths from the drill maps that are included in the dataset but not already on the report grid are shown to the user. For example, you can drill from Year only down to Quarter in the example shown below. You cannot drill further down to Day because Day is not included in the dataset.

Drilling within the dataset can be used to reduce the paths from those that are defined in the drill map. It does not include paths that are not defined in the drill map, even if an attribute in the dataset does not have a drill path.
-
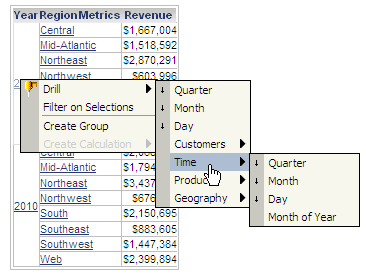
To allow users to drill on attributes other than those available in the dataset, select Drill anywhere. By default, when you enable drilling in a Grid/Graph, users can drill anywhere. If the dataset does not have a custom drill map, the drill paths in the project drill map are used. Drilling anywhere allows the user to view associated data within the same attribute or across attributes, whether at the same level, a higher level, or a lower level. For example, even though only Year and Quarter are included in the dataset, the other attributes in the Time hierarchy can be drilled to because the Grid/Graph allows drilling anywhere, as shown below.

-
-
You can enable users to automatically drill on another grid or graph (the target) when they drill on the grid or graph that is currently selected (the source). This is called synchronized drilling. For example, a grid containing profit data across several product categories targets a graph displaying inventory data. If a user drills to Subcategory in the grid, the graph will automatically be updated to display inventory data drilled to the Subcategory level.
Select grids or graphs from the Available list and click > to add them to the Selected list. When users drill on the source grid or graph, each of the grids or graphs added to the Selected list will also be updated. The Drill Options setting must be set to Drill Within.
-
The Keep parent while drilling option determines whether the original object (the object that the user drills on) appears in the destination report. For example, if a user drills from State to City when Keep parent is selected, State remains on the destination report. If the Keep parent option is not selected, the parent attribute is removed. The same drill would result in a destination report with City but not State.
By default, whether or not the parent attribute is retained in the drilled-to report, is determined by the setting in the report definition. To override this setting, click Preferences at the top of any page, click Drill Mode on the left, and select Yes or No from the Keep parent while drilling drop-down list.
-
The Keep thresholds while drilling option determines whether a threshold set in the original report is still displayed in the destination report (after the drill). For example, a threshold is defined to bold revenue values greater than $1 million. If a user drills from Store to Employee when the Keep thresholds option is selected, any revenue value over $1 million is shown in bold font. If the option is not selected, none of the revenue values are bolded.
By default, whether or not thresholds are retained in the drilled-to report, is determined by the setting in the report definition. To override this setting, click Preferences at the top of any page, click Drill Mode on the left, and select Yes or No from the Keep thresholds while drilling drop-down list.
-
Click OK to save the changes and return to the document.
You can enable or disable specific display modes for end users; see Determining display for end users.
