Strategy ONE
Adding a Grid/Graph that uses multiple datasets
Objects from multiple datasets can be displayed in a single Grid/Graph. For example, a document contains two datasets. The Regional Revenue dataset contains Region and Revenue, while the Regional Profit dataset contains Region and Profit. The original datasets are displayed in the two Grid/Graphs on the top, with their dataset names displayed in the title bar. The Grid/Graph on the bottom contains data from both datasets.
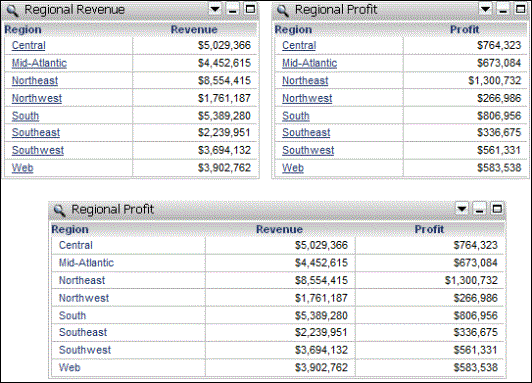
The title bar on the bottom Grid/Graph also displays its dataset name—Regional Profit. Although the data comes from both datasets, Profit, which comes from the Regional Profit dataset, was added to the Grid/Graph last. If Revenue, from the Regional Revenue dataset, was added after Profit, the Grid/Graph's dataset would be set to Regional Revenue.
To show the dataset name in the Grid/Graph title bar, display the title bar but do not add a name for the Grid/Graph. For detailed steps, see Adding title bars to Grid/Graphs.
The dataset (or data source) of a Grid/Graph that uses multiple datasets is determined by the last object added to the Grid/Graph. For example, the Category attribute and Revenue metric from Dataset1 are dragged onto a blank Grid/Graph. The Grid/Graph's data source is therefore defined as Dataset1. If you place the Region attribute from Dataset2 on the Grid/Graph, the data source changes to Dataset2. If you delete an object from the Grid/Graph, the data source does not change. Only the addition of an object updates the source for the Grid/Graph; removing or deleting an object does not. You can also change the data source; see Changing datasets in Grid/Graphs for steps.
To allow a single Grid/Graph to contain objects from multiple datasets, you must have the Import Table from Multiple Data Sources privilege. For steps to create a Grid/Graph that uses multiple datasets, see Adding a Grid/Graph with multiple datasets.
By default, a project allows Grid/Graphs to contain objects from multiple datasets. However, you can change the project configuration settings to require that all objects in a single Grid/Graph come from a single dataset. For steps, see Determining whether Grid/Graphs can use multiple datasets.
Primary and secondary datasets: Same attributes, different metrics
Because the two datasets in the example above contain data for the same attributes, the data can be joined and information for all metrics and all attribute elements can be displayed.
The Regional Revenue dataset is replaced on the document by the Northern Revenue dataset, which is filtered to include only the Northeast and Northwest regions. The new document is shown below. Notice that all the regions are still included in the Grid/Graph that uses both datasets (renamed to Combined Grid/Graph), but revenue amounts are available only for Northeast and Northwest.

The Regional Profit dataset is replaced on the document by the Southern Profit dataset, which is filtered to include only the South, Southeast, and Southwest regions. Because the datasets do not contain the same attributes, the Combined Grid/Graph has holes in its data, as shown below:
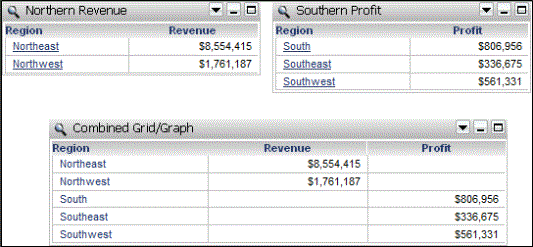
By default, both datasets are primary datasets. All of the elements from a primary dataset are displayed, as shown in the example above. Specifying the join behavior of a dataset as either primary or secondary specifies which datasets determine the attribute elements that appear in the results.
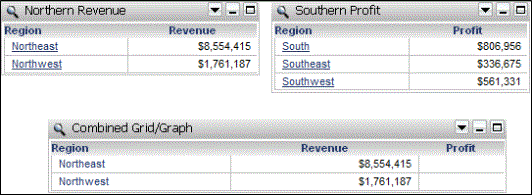
Southern Profit is changed to a secondary dataset. Elements from a secondary dataset is displayed only if they also appear in a primary dataset. Because the southern regions are not in the Northern Revenue dataset, they are not displayed in the Combined Grid/Graph, as shown below. Profit is not displayed for the northern regions because that data does not exist in either dataset.
If both datasets are changed to be secondary datasets, the Combined Grid/Graph is blank because none of the attribute elements appear in a primary dataset. This scenario is shown below:
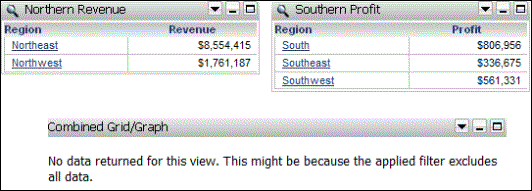
Having the same attributes in multiple datasets can result in blank data or an entirely blank Grid/Graph. This especially occurs if different filters on the same attribute are applied to the datasets. If you add a selector on the shared attribute, end users can be confused about which attribute elements are displayed in the selector and which in the target Grid/Graph. A slicing selector shows only the items available in the target, while a filtering selector shows all the items available in all the datasets. While you design your document and datasets, keep these differences in mind. For examples of selectors on an document that contains multiple datasets, see the Dashboards and Widgets Creation Guide.
In the Dataset Objects pane, any attributes common to multiple datasets are displayed with a blue icon, as Category is in the example shown below:
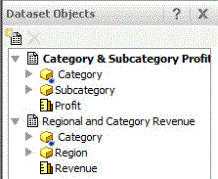
For a more detailed explanation of primary and secondary datasets, see Working with multiple datasets and Defining a dataset as primary or secondary. Although the examples in that section use text fields, the same principles apply to Grid/Graphs.
Resolving metrics used in multiple datasets: Same attributes, different metrics
In the examples above, the datasets used different metrics. If the same metric exists in more than one dataset, the Grid/Graph's data source determines which metric is used.
For example, the Regional Revenue report contains Region and Revenue. The Northern Revenue report also contains Region and Revenue, filtered for Northeast and Northwest. Both reports are used as datasets on a document. Region from the Regional Revenue dataset and Revenue from the Northern Revenue dataset are placed into a single Grid/Graph, as shown below. The data source of the combined Grid/Graph is set to the Northern Revenue dataset automatically, based on the metric, and indicated by the title bar, which displays the data source automatically. The combined Grid/Graph displays only Northeast and Northwest.
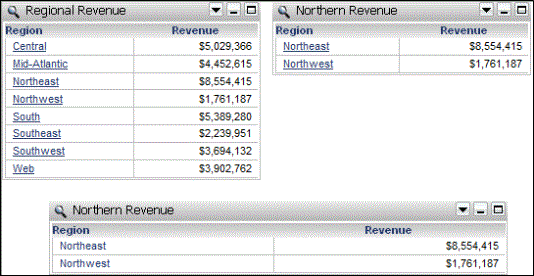
Change the data source of the combined Grid/Graph to Regional Revenue, and all the regions, with their metric values, are displayed. The Grid/Graph's data source is determining which metric and attribute is being used.
Change the data source of the combined Grid/Graph to none. Without a data source, the Grid/Graph cannot determine which metric to use, so no metric values are displayed. Because Region initially came from the Regional Revenue dataset, all the regions are displayed, as shown below:

Setting the data source of the combined Grid/Graph to none allows you to see the elements from all the datasets.
Joining multiple datasets in a Grid/Graph: Different attributes, different metrics
A document contains the following datasets:
- Revenue by Category: Category attribute and Revenue metric
- Regional Profit: Region attribute and Profit metric
These datasets do not have any attributes or metrics in common. The Combined Grid/Graph combines Category and Revenue from the Revenue by Category dataset with Region and Profit from the Regional Profit dataset, as shown below. The Revenue amounts can be calculated at the Category level, since the data exists in the Revenue by Category dataset. The Profit amounts cannot be calculated at the Category level, because the data exists only at the Region level. However, the Profit amounts can be calculated and displayed at the Region level in the Combined Grid/Graph—they are repeated for each Category in a particular Region.

If you switch the positions of the attributes on the Combined Grid/Graph, at first glance it appears that the metric calculations have changed. The order in which they are presented has changed, but not the actual calculations. The revenue for Books - Central is still $2,640,094, while the profit is still $764,323. Now, all the same Revenue amounts are grouped together, instead of the same Profit amounts as in the previous example.
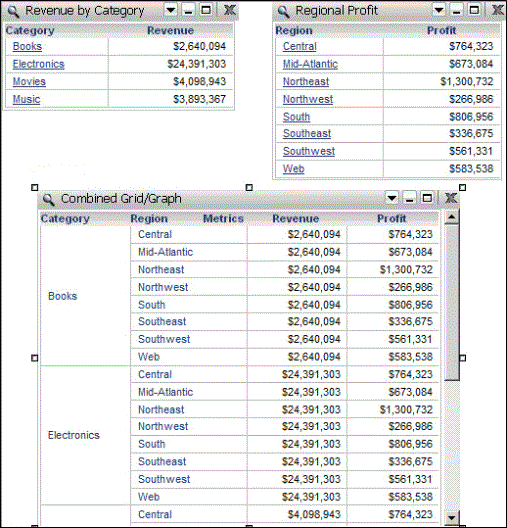
If you remove Region from the Combined Grid/Graph, the Profit amounts are all the same—the total profit. (Totals were added to the individual Grid/Graphs for comparison.) This occurs because the Profit data exists only at the Region level. Revenue amounts are calculated for each category, since the Revenue data exists at the Category level.
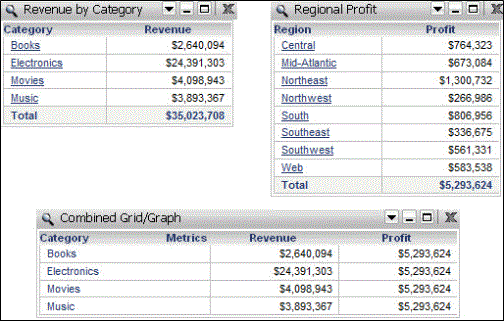
Similarly, if Category had been removed instead of Region, the Profit amounts would be calculated for each region, while the Revenue amounts would all display as the total shown on the Revenue by Category Grid/Graph.
The Revenue by Category dataset is replaced by the same dataset filtered for payments made with Visa and Mastercard only. Notice that the Revenue amount has decreased in the Revenue by Category Grid/Graph, as well as the Combined Grid/Graph. Profit is unaffected, since the filter has not been applied to the Regional Profit dataset.

Notice that, unlike a Grid/Graph that uses datasets with the same attribute, this Grid/Graph can calculate metric data for all the attributes and metrics, in multiple combinations, in the datasets.
For more examples of how datasets are joined, see Joining multiple datasets: Examples. Although text fields are used in the examples, the same join behavior applies to Grid/Graphs.
View filters on a Grid/Graph with multiple datasets
A view filter on a Grid/Graph places conditions on attributes and metrics which restrict the amount of data displayed on the Grid/Graph. A view filter on a Grid/Graph with multiple datasets can include any objects on the Grid/Graph, regardless of the Grid/Graph's data source.
For background information on view filters, including steps to create them, see Using view filters on Grid/Graphs. For an example of a view filter on a Grid/Graph with multiple datasets, see View filters in documents with multiple datasets.
Thresholds on a Grid/Graph with multiple datasets
Thresholds are special formatting that is automatically applied to data in a Grid/Graph, when the data meets a specified value. The special formatting means that document recipients can easily see which data is likely to be important for making business decisions.
A threshold on a Grid/Graph with multiple datasets can include any objects on the Grid/Graph, regardless of the Grid/Graph's data source.
For background information on thresholds, including steps to create them, see Formatting conditional data in documents. For an example of thresholds on a Grid/Graph with multiple datasets, see Conditional formatting on a document with multiple datasets.
Adding a Grid/Graph with multiple datasets
Prerequisites
- You must have the correct privileges:
- To view Grid/Graphs that use objects from multiple datasets, you must have the Execute Report that Uses Multiple Data Sources privilege.
- To create Grid/Graphs that use objects from multiple datasets, you must have the Import Table from Multiple Data Sources privilege.
- The project must allow Grid/Graphs to use multiple datasets, as explained in Determining whether Grid/Graphs can use multiple datasets.
- The document must contain the datasets to be used in the Grid/Graph.
- In MicroStrategy Web, open the document in Design Mode.
-
Add an empty Grid/Graph, by doing one of the following:
- To add a placeholder that displays as a grid, select Grid from the Insert menu.
- To add a placeholder that displays as a graph, point to Graph on the Insert menu, and select the graph style. For descriptions of the various graph styles, see the Advanced Reporting Guide.
-
Click and drag in the section where you want the Grid/Graph placeholder. A new Grid/Graph placeholder is displayed as an empty Grid/Graph in the document.
You can place a Grid/Graph placeholder anywhere in a document except in the Detail section. Since controls in the Detail section are repeated once per row of the dataset, the Grid/Graph would be repeated on each row.
-
Select an object in the Dataset Objects panel, and then drag and drop it in the empty Grid/Graph. Repeat for each dataset object needed on the Grid/Graph.
The dataset (or data source) of the Grid/Graph that uses multiple datasets is determined by the last object added to the Grid/Graph.
