MicroStrategy ONE
Formatting conditional data in documents
Thresholds and conditional formatting are special formatting that is applied to data automatically, when the data meets a specified value. The special formatting means that document recipients can easily see which data is likely to be important for making business decisions. You can have specific controls in your document formatted depending on predefined criteria that you specify. You can use:
-
Thresholds to change the format of data cells in your report or Grid/Graph.
-
Conditional formatting to change the format of controls such as text fields, images, sections, and so on in your document.
For example, a document contains customer order information. Any customers with an order over $100 in the past three months can be displayed in italicized blue font, to ensure that they receive special promotions. Any customers who live in a particular city can be displayed in a bold red font, so that they can receive a notice about a new store opening there.
You can use conditional formatting to format a control in the following ways:
-
Hide the control
-
Format the control in a particular way, for example, display profit values greater than $1,000,000 in bold text
-
Replace the control with text, such as Goal Met for units sold greater than 50,000
-
Replace the control with a symbol, such as a diamond for sales above $100,000
-
Replace the control with an image, such as a corporate logo for costs below $50,000
Whether you can replace data with text, an image, a quick symbol, or by hiding the control, depends on the type of control that is selected when you begin to create your conditional format. The following table lists the control types and the types of conditional formatting available for each.
|
Control Type |
Conditional Formatting |
|
Image |
Hide object Formatting: Borders |
|
Line |
Hide object Formatting: Line style, color, and weight |
|
Rectangle |
Hide object Formatting: Background color; Line style, color, and weight |
|
Text field |
Hide object Replacement text and symbols Formatting: All formatting settings |
|
Section |
Hide object Formatting: Background color |
|
Grid/Graph |
Replacement text, symbols, and images Formatting: All formatting settings You can apply conditional formatting (or thresholds) to an object in a Grid/Graph, but the method is slightly different. For information on creating thresholds in reports, see the Basic Reporting Guide. |
You can create alerts to notify users when a metric or attribute on a report meets a specific threshold condition. For information to create mobile or email alerts, see the Basic Reporting Guide.
When you create conditional formatting, you define two parts: the condition, and the formatting that will be applied to the control when the conditions are met. The data that meets the condition is considered to be data that has passed the threshold of the condition. Once the data passes the threshold, formatting is automatically applied to the control, or the control can be hidden, or replaced by text, symbols, an image, and so on.
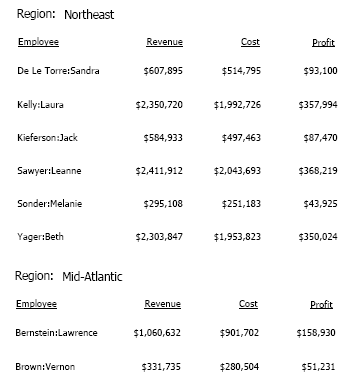
For example, the following document contains cost, profit, and revenue by region and employee, and is grouped by region.

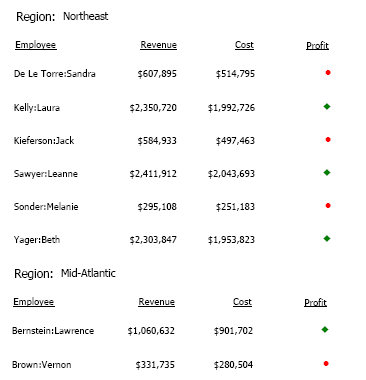
The document needs to provide a quick summary of the profit information, so the profit data must be replaced with a green diamond if the profit is $100,000 or greater, and a red hexagon if it is less. The final document looks like the following:

This example uses a metric from the dataset in the condition. You can also use derived metrics, summary metrics, and attributes in the condition. For examples, see Derived metrics, summary metrics, and attributes in conditional formatting.
You can create criteria for conditional formatting by qualifying data based on a metric or an attribute. Derived metrics and summary metrics can be used to create conditional formatting; calculated expressions cannot.
