Strategy One
Track API Requests and Responses for Self Service
Starting in Strategy One (December 2025), you can use Open Web Debug Console to open Chromium developer tools in Workstation. Use the built-in API tracing in Workstation to see what is happening in the backend, allowing you to inspect request and response details, understand API performance, and diagnose failures quickly before raising issues to Strategy Cloud Support.
The Open Web Debug Console is only available in windows and tabs that are powered by Chronium Embedded Framework (CEF).
Prerequisites
You must have the View Workstation Debug Console privilege.
Use the Debug Console
- Open the Workstation window.
- In the Navigation pane, click a page where the debug console is available, for example, Documents.
-
Click Open Web Debug Console.
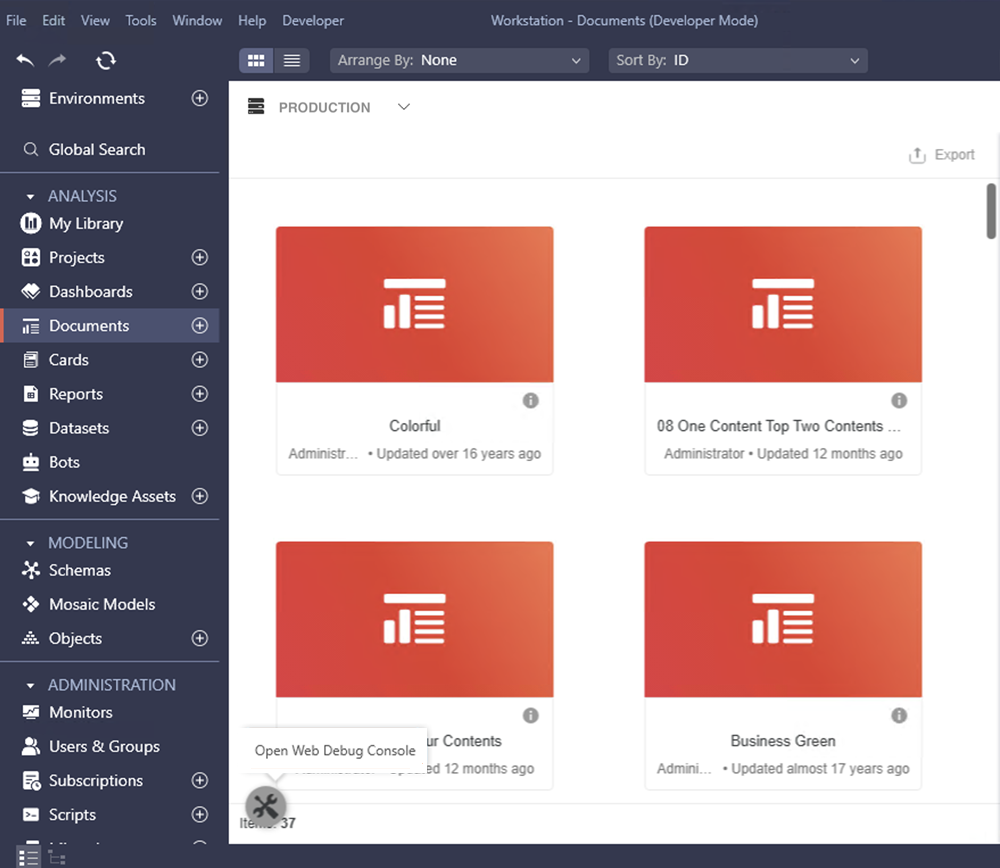
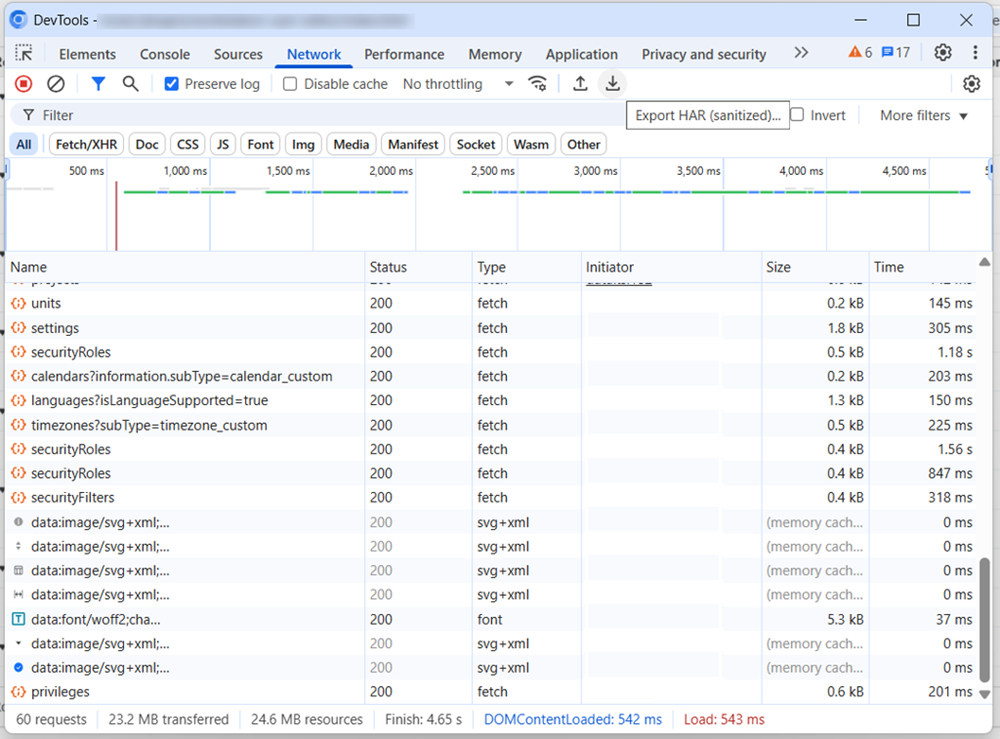
The Chormium DevTools window displays valuable troubleshooting data, such as network traffic and console logs.
-
Strategy recommends refreshing the window using
Ctrl+RorF5. -
Optionally select the check box next to Preserve log to keep logs between navigation steps and click Export HAR in the toolbar to export the logs.
Additional Information
-
The debug console is isolated to one Workstation window, so when you open a new editor window, for example, you must also open a new console.
-
You can also open the console using
Ctrl+Shift+IorF12. -
If you login to an environment where a user does not have the necessary privileges to use the debug console, the console will close.
-
In dialogs that display content related to multiple environments, for example, Migrations, the Open Web Debug Console option will not be available.