Strategy One
Display and Hide Subtotals
Subtotals reflect data rolled up to an attribute level. Therefore, subtotals refer to all types of totaling, including grand totals, totals, and subtotals, depending on the attribute levels included in the report and how the subtotal is applied.
You can display and hide subtotals on reports:
-
A grand total is a total of all calculations on a report, for each metric.
-
A total is a total of a specific subset of metric data, totaled at a level you select. (For a definition and examples of levels of aggregation, see the Basic Reporting Help.)
Common subtotal functions include total, count, minimum, maximum, average, mean, and median.
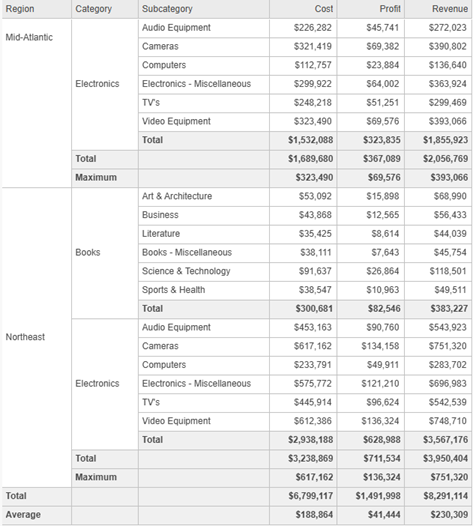
For example, the following image shows the bottom of a report that displays subtotals for:
-
The Total function at the category, region, and grand total levels
-
The Maximum function at the region level
-
The Average function at the grand total level
A metric designer or report designer must enable subtotals as part of a metric's definition. If subtotals are available for a metric, you can display or hide them for that metric on a given report. You can add a new type of subtotal to the report. For example, if a report currently displays a Median subtotal, but you would prefer to see an Average subtotal, you can add the Average subtotal to the report. You can also permanently remove totals from the report.
You can add totals to a report on a document. For steps, see Analyze Documents.
To Display or Hide Existing Subtotals on a Report
- Click the name of a report to execute it. The report must be in either Grid view or Grid and Graph view.
-
Click Toggle Totals
 on the Data
toolbar. (To display the Data toolbar, click Data in the menu bar.)
on the Data
toolbar. (To display the Data toolbar, click Data in the menu bar.)Alternatively, from the Data menu, select Show Totals. If this option does not display, subtotals have not been enabled for at least one metric on the report.
To Define Totals on a Report
- Click the name of a report to execute it. The report must be in either Grid view or Grid and Graph view.
- From the Data menu, select Edit Totals.
-
Select the subtotal functions (such as Total or Maximum) to display. Click the Definitions tab. For each subtotal function to display, select the All Subtotals check box or the Grand Total check box.
The list of subtotal functions is determined when the metric is created. If no functions are listed, subtotals have been disabled. For more information, contact the report's creator.
-
Click the Advanced tab.
-
Specify how each metric subtotal is calculated. From the drop-down list at the top, select a subtotal. Do one of the following:
For a definition of a level and examples, see the Basic Reporting Help.
-
To calculate the subtotal by its position on the report, select By Position. From the Rows, Columns, and Pages (page-by fields) drop-down lists, select the subtotal to apply to that part of the report. Each of these is considered an axis of the grid report. The options are:
- All Subtotals: Apply the subtotal across all levels on the axis.
- Grand Total: Apply only the subtotal across the whole axis.
- None: Apply the subtotal to no level of the axis.
- Selected Subtotals: For pages only, apply only selected subtotals across the axis.
- To calculate the subtotal for specific attributes, select Across level.All attributes available in the report are listed for you to choose from. Select the check boxes for the attributes to calculate a subtotal for.
-
- Click the Display tab to define where the subtotals display in the grid. For each axis in the grid, any subtotals calculated can be displayed in two ways: top of each level or bottom of each level.
- In the Subtotal positions by row area, select one of the following:
- Top of each level: Displays the row subtotal at the top of each level at which the metric is calculated.
- Bottom of each level: Displays the row subtotal at the bottom of each level at which the metric is calculated.
-
In the Subtotal positions by column area, select one of the following:
- Left of each level: Displays the column subtotal at the left of each level at which the metric is calculated.
- Right of each level: Displays the column subtotal at the right of each level at which the metric is calculated.
-
In the Subtotal positions by page area, select one of the following:
- Top of each level: Displays the page subtotal at the top of each level at which the metric is calculated.
- Bottom of each level: Displays the page subtotal at the bottom of each level at which the metric is calculated.
- To preview the subtotals, click Apply.
- When the subtotals are correct, click OK.