Strategy One
How to Add Custom Shapes to Geospatial Services Visualizations
You can create custom shapes to use in a geospatial services visualization by importing KML files into Workstation.
Importing KML Files for Custom Shapes
- Open a new or existing dashboard.
-
To import data into a new dataset, click Add Data
 and choose New Data.
 -
Click File From Disk to import data from a file on your computer.
-
Click Choose files. Browse to your .kml file and click Open.
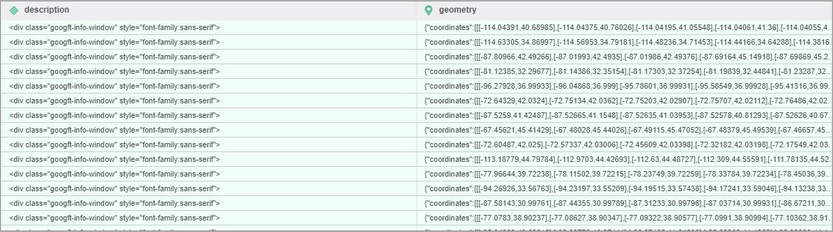
Boundaries information will be extracted as a geometry attribute, with the Geometry geoRole applied.
Adding Custom Shapes to a Visualization
- In the top toolbar, click Insert Visualization
 .
. - Choose Map > Geospatial Service
 .
. -
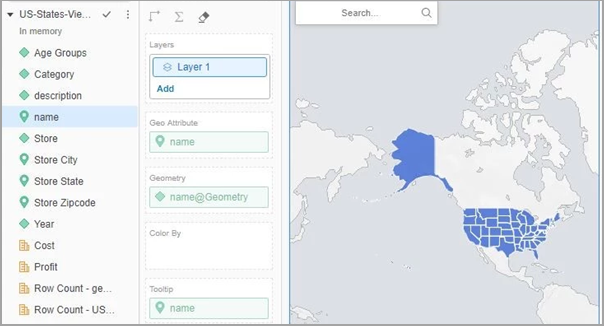
Double-click on the geometry attribute to add it to the visualization.
On the Editor panel, a new Geometry drop zone appears below the Geo Attribute drop zone containing your geometry attribute.
On the Format panel, you will see that Type has been set to Area and Boundary has been set to Custom Shape automatically.
Though basic functionality like selections, keep only, and exclude are all enabled at this point, for better filter performance, attributes should be added to the Geo Attribute drop zone. A warning icon appears when the Geo Attribute drop zone is empty and the Geometry drop zone contains a single-form attribute. While the warning icon is present, the page will hang during execution if the POST size limit of the web server is exceeded.
Attribute Linking to practical datasets
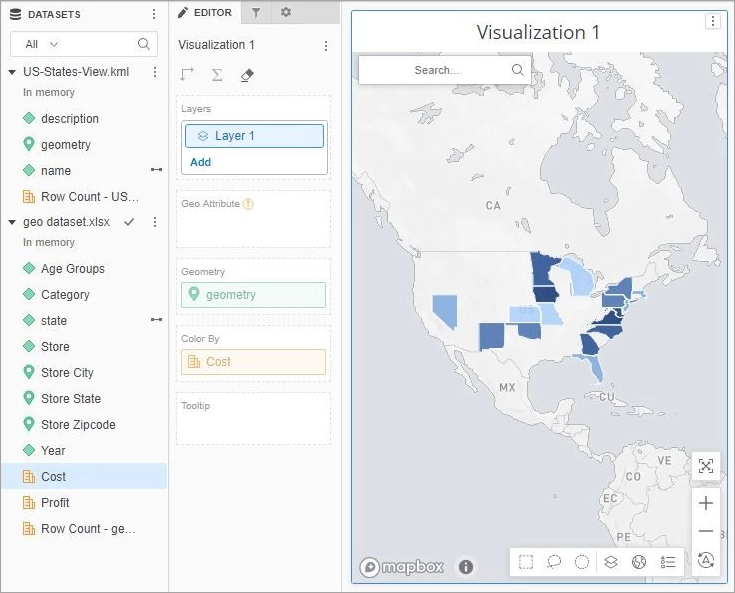
You can link attributes between your custom shape file and other datasets. In the example below, the attributes name in the shape file and state in the dataset contain corresponding values. Linking the two attributes allows you to add metrics from the dataset to the geospatial services visualization. For example, adding Cost to the Color By drop zone will apply the custom shapes to only the states that contain a Cost value in the dataset.
Practical Suggestions
- Perform attribute linking during the data import process.
-
Create multi-form attributes from the geometry and geoRole attributes.
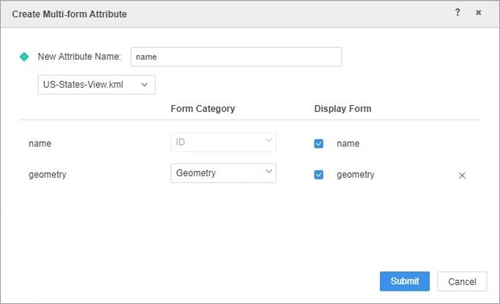
Since data label functionality depends on the Geo Attribute drop zone, creating multi-form attributes will help to avoid errors. Adding the multi-form attribute shown above will appear on the Editor panel with the Geo Attribute drop zone already populated.