Strategy One
View Reports
To view a report, open the Library Home page and select a report tile.
If the report contains prompts, the Prompt page displays; answer the prompts to continue executing the report.
A prompt is a question presented to the user who runs the report. Any report can contain prompts. Depending on the answers the user provides, the report brings back and displays different data from your data source. For details to answer prompts, see Introduction to Prompted Reports.
The report results display.
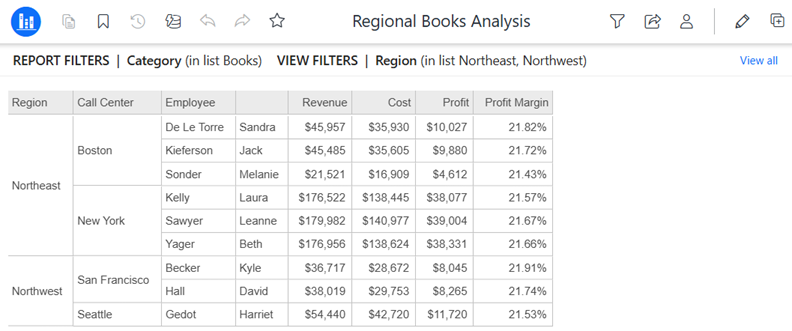
Filter Summary
The filter summary below the toolbar displays the report filters and view filters, allowing you to review how the report is filtered.
If the report does not contain any filters, the filter summary still displays, as shown below:
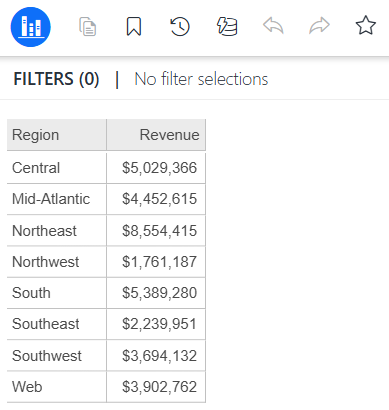
-
If the filter summary is not shown, you can display it.
-
You can edit view filters. Expand the summary by clicking View All. The Filter Data panel displays. Edit the view filter.
Page the Report
If the report is paged, drop-down lists display at the top of the report. In the example below, the report is paged by region and call center.
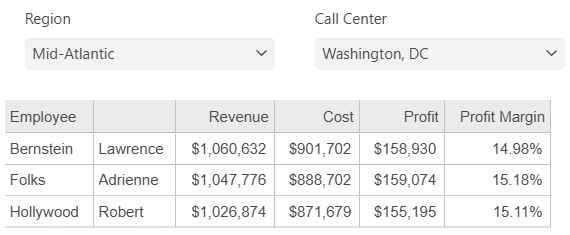
To change the subset of data displayed, select an option from a page-by drop-down list. Page-by turns a long report into a set of individual pages so that you can focus on one page (data subset) at a time.
Report Toolbar
Use the toolbar to:
-
Return to the Library Home page
 .
. -
If the report is paged, the Page-by icon
 is enabled. Use it to hide and display the page-by lists.
 -
Create and use bookmarks
 , which are personal views saved for your unique analysis.
 -
Reset
 the report to return to your original report after performing any manipulations.
 -
Re-execute
 the report against its data source.
 -
Undo
 or reverse an action.
 -
Redo
 or restore an action.
 -
Re-prompt
 the report to change your prompt answers.
 -
Add to Favorites
 to display the report in the Favorites section of your Library Home page.
-
If the report is already a favorite, the star icon is filled in. Click it to remove the report from Favorites.
-
-
Filter
 the report by adjusting the view filter. When you click Filter, the Filter Data panel displays.
 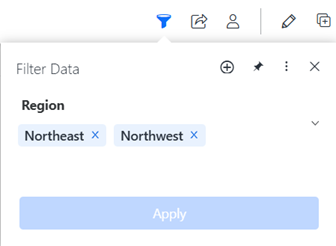 Click here for steps to work with view filters.
-
If the report already contains a view filter, you can modify it, as described below:
-
In the Filter Data panel, click the view filter to modify.
-
Make the changes, such as adding or removing an attribute element or adjusting a metric value.
-
Click Done to complete the condition.
-
You can modify other view filters using the steps above.
-
When all your view filters are complete, click Apply.
-
-
If the report does not contain a view filter, you can add one, as described below:
-
In the Filter Data panel, click Add
 .
. -
From the Based On drop-down list, select the object (attribute or metric) on which you want to base your filter. Only the report's objects are available.
-
Define the filter condition, such as Region = Northeast or Revenue Greater than 1,000. The definition options vary depending on the type of object you added to the filter. For more details, see Define the condition.
-
Click Done to complete the condition.
-
You can create other view filters using the steps above.
-
When all your view filters are complete, click Apply.
-
-
Remove all the view filters. In the Filter Data panel, click more
 and select Remove All Filters. Click Apply.
 -
Pin
 the Filter Data panel to keep it open.
 -
Hide the Filter summary (view filter and report filter) that displays below the toolbar. To do this, in the Filter Data panel, click more
and select Hide Filter Summary.-
To show the Filter summary again, click more
and select Show Filter Summary.
-
-
If the Filter icon is not available, the application creator chose not to display it.
-
Share
 the report by inviting users to view it; managing access; exporting it to Excel, Google Sheets, CSV, or PDF; or subscribing to it.
 -
View your Account settings
 to set preferences, view links to help and support, see a tutorial on using Library, or log out.
 -
Edit
 the report.
 -
Duplicate
 the report to save a personal copy of it in your My Reports folder. Any manipulations you made, such as sorting, filtering, and answering prompts are saved with the personal copy.