Strategy One
Add a View Filter to a Report
Once a report is displayed, you can narrow its results by applying a view filter to the report. A view filter includes one or more filtering conditions that restrict the data displayed in the report. Unlike a report filter, once the view filter is applied, it does not retrieve data from the data source. Instead, a view filter restricts data based only on the report results already displayed on the screen.
You can create a view filter by qualifying on any attribute or metric on your report. While attribute and metric qualifications both restrict the data displayed on the report, they are created and defined in slightly different ways.
You can create a view filter in any report. This includes reports connected to an Intelligent Cube, reports returning information directly from a data warehouse, Freeform SQL reports returning information from Excel spreadsheet, and so on.
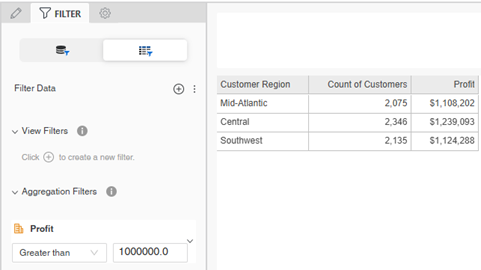
For example, in the report below, the view filter is applied after the original report was executed. The original report included data for all seven regions. When the view filter condition is applied, the only data displayed on the report is for regions that generated more than $1,000,000 in profit. Therefore, only three of the original seven regions display in the new report results.
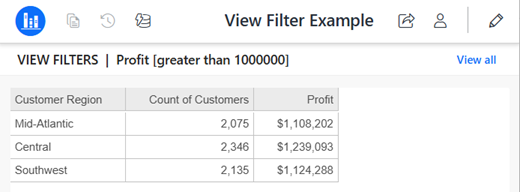
When you view a report in Library, a description of its filters displays above the report results. In the example below, the report contains a view filter on Profit. To change the view filter, click Edit.
Filter Data Displayed on a Report Using a View Filter
-
Open the report to filter. On any page in Library, search for or navigate to the report. Right-click the report and select Edit.
- The report displays with data retrieval paused. Click Resume Data Retrieval
 so you can view the initial report and then see the results of the view filter.
 -
Click Filter
 to display the Filter panel.
 -
Click View Filters
 to display the Filter Data tab on the Filter panel.
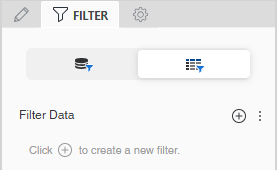
-
In the Filter Data tab, click Add
 .
. -
From the Based On drop-down list, select the object (attribute or metric) on which you want to base your filter.
- Define the filter condition, such as Region = Northeast or Revenue Greater than 1,000. The definition options vary depending on the type of object
you added to the filter.
- If you are filtering based on an attribute:
- By default, the filter qualifies on the attribute elements in a list. You can select Not in List instead. Select the check boxes for the elements to include or exclude. For example, the view filter definition below displays the Mid-Atlantic, Southeast, and Northeast regions in the report.

- You can instead qualify on an attribute form, which compares a selected attribute form (such as ID or Description) to a specific value.
From the Qualify On drop-down list, choose the attribute form to filter on.
From the Operator drop-down list, select a comparison operator such as Does Not Equal or Contains.
Type the Value to compare the attribute element to.
If you filter based on a date or time attribute, such as ship date or invoice date, you can compare it to a dynamic date. A dynamic date is a date that is a fixed offset from the current date. For steps, see Define a Dynamic Date.
Click here to view steps to create the attribute form qualification.For example, the filter definition below displays Customer Region descriptions that contain the value South on the report.
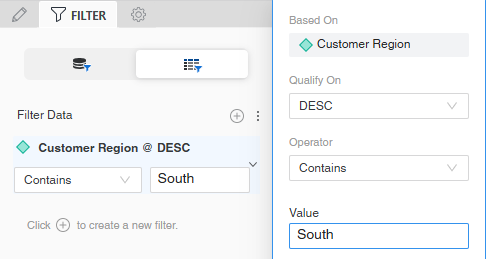
- By default, the filter qualifies on the attribute elements in a list. You can select Not in List instead. Select the check boxes for the elements to include or exclude. For example, the view filter definition below displays the Mid-Atlantic, Southeast, and Northeast regions in the report.
If you are filtering based on a metric, create the filter definition.
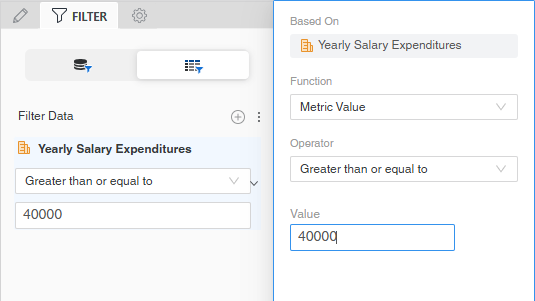
Click here to view steps to create the filter definition.From the Function drop-down list, select whether to filter the metric on Metric Value, Rank, or Percentage
From the Operator drop-down list, select a comparison operator such as Does Not Equal or Contains.
If you are filtering by rank or percentage, you can select the level to restart counting. From the Break By drop-down list, select the attribute level.
Type the Value to compare the attribute element to.
For example, the filter definition below displays Yearly Salary Expenditures metric values greater than or equal to 40,000 on the report.
- If you are filtering based on an attribute:
- Click Done to complete the condition.
-
You can add NOT to the filter condition so that the report returns everything that doesn't match the filter condition. To do this, click the menu icon to the left of the filter and select the NOT check box.

Now the filter returns everything except the Books category.

- You can create more filter conditions to further refine the report display.
-
Change the order that the filters are evaluated. In the Filter Data panel, click and drag a filter to another location.
-
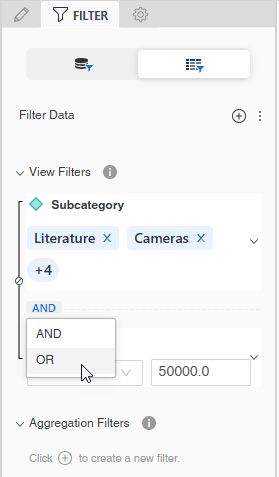
Change the operator that joins the filters. By default, all filters are joined with the AND operator, meaning that data must meet all filters to be included in the report. To change the operator to OR, meaning that data must meet only one of the filters to be included, click AND and select OR.
- Add NOT to the operator, by clicking the not icon
 between the filters. This means that the report returns everything that doesn't match the filters.
 -
To apply the view filter, click Apply.
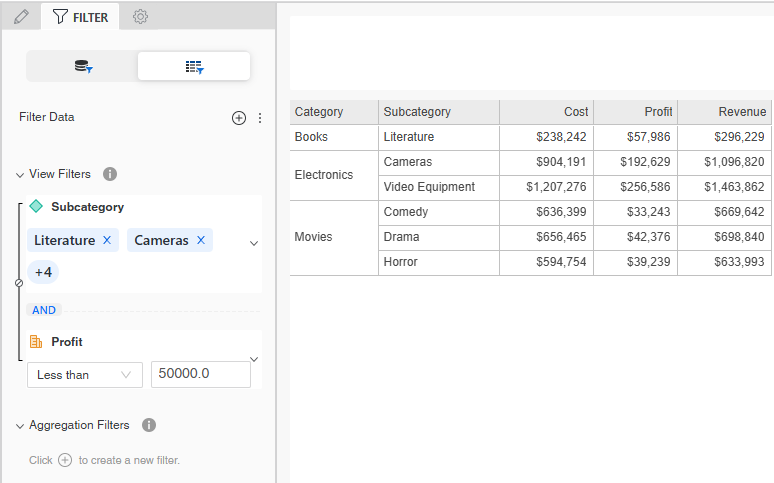
Attribute conditions are listed under View Filters, while metric conditions are listed under Aggregation Filters. In the example below, Subcategory, an attribute condition, displays as a view filter, while Profit, a metric condition, displays as an aggregation filter. By default, the metric in a view filter condition calculates at the level of the attributes displayed on the report grid, although you change it to calculate at the level of all the objects on the report. For an example and steps to change the calculation level, see Change a Metric Condition's Calculation Level.

If you add multiple filters, whether stand-alone or in-report, you can:
Remove a View Filter
-
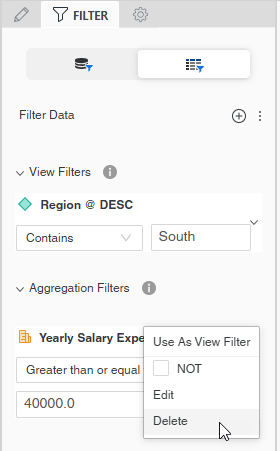
To remove a single view filter, click the more icon
 for the filter and select Delete.
 -
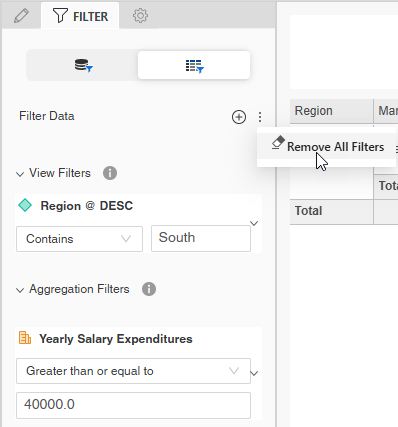
To remove all the view filters, click the menu icon
 next to Filter Data and select Remove All Filters.
 -
If data retrieval is active, click Apply to remove the filters. If data retrieval is paused, the update is applied when you resume data retrieval.
Change a Metric Condition's Calculation Level
Attribute conditions are listed under View Filters, while metric conditions are listed under Aggregation Filters. In the example below, Subcategory, an attribute condition, displays as a view filter, while Profit, a metric condition, displays as an aggregation filter. The report returns three rows with Profit values below $50,000.
By default, the metric in a view filter condition calculates at the level of the attributes displayed on the report grid, although you change it to calculate at the level of all the objects on the report. This condition calculates at the lowest level on the grid, which is Subcategory.
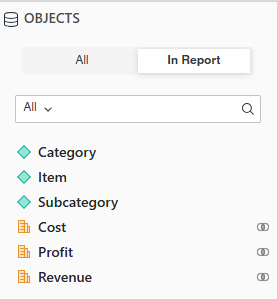
This report contains Item, as shown below, although it is not displayed on the report grid. Item is the lowest level on the report.
When the metric condition is evaluated as a view filter, the Profit metric calculates at the lowest level on the report, which is Item. The report now returns six rows; although the Profit values displayed are still calculated at the Subcategory level, items within those subcategories have Profit values below $50,000.
-
To change the metric condition's calculation level, click the more icon
for the filter and select Use as View Filter. 
-
If the metric condition displays in the View Filters area, you can change it to calculate at the report grid level. Click the more icon
for the filter and select Use as Aggregation Filter. -
Click Apply.