Strategy One
Introduction to Waterfall Chart Visualizations
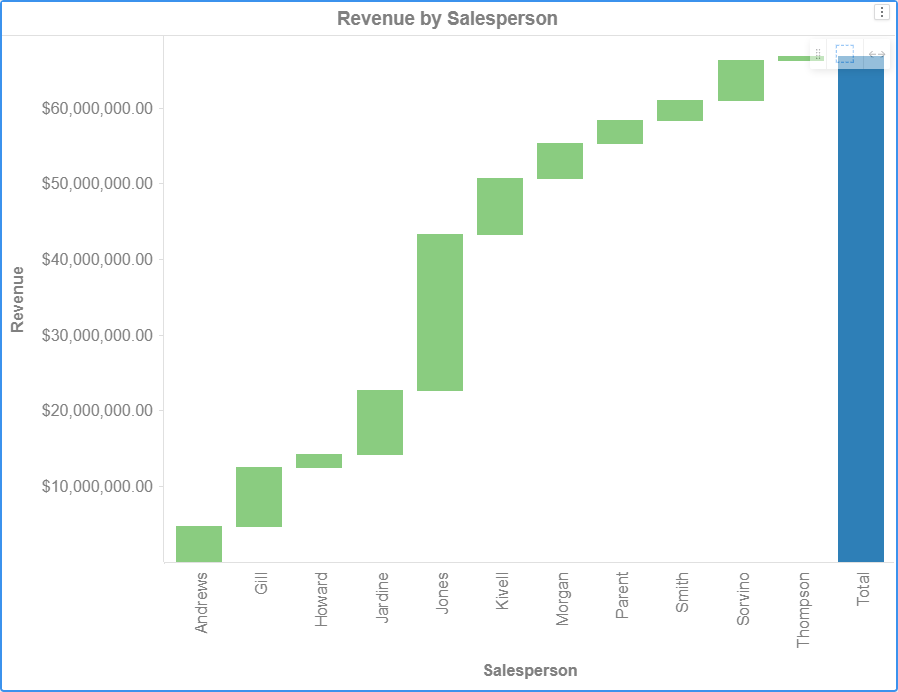
A waterfall chart visualization displays bars, representing metric values, for each element of an attribute in an ascending or descending order, leading to a final total. A waterfall chart must include at least one attribute and at least one metric.
Related Topics
Introduction to Waterfall Chart Visualizations
How to Select Data in a Histogram or Waterfall Chart
Zoom and Pan on a Histogram, Waterfall Chart, or Box Plot
How to Drill In and Out of a Waterfall Chart
View Information About Visualization Elements