Strategy One
Linking to Other Documents and Reports
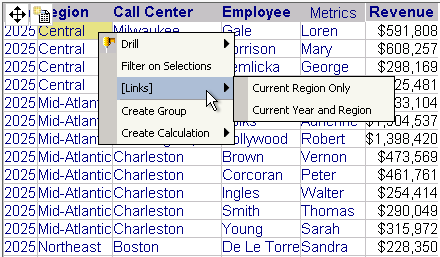
An underlined attribute can mean that the object is linked, as well as being a starting point for a drilling. A link is a connection in a document to another document, a report, or a web page. A link lets you execute another document or report (the target) from a document (the source), and to pass parameters to answer any prompts that are in the target.
For example, if you are viewing a document containing regional sales, you can click a particular region to execute another document that displays sales for the stores in that region. This is a form of drilling, where you have drilled from region to store. The source document could also link to the underlying dataset report, to display profit and cost values as well. The source could link to a web page that contains economic information about the region.
You can link from:
The examples above link to documents or reports, but a link can also Linking a Document to a Web Page.
Linking a Document to a Web Page
Text or images can link a document to a web page. When you open the document, you can click the link to navigate to the link's target web page. For example, when you hover the pointer over the logo, it changes to a hand to indicate the link, as shown below:
When you click the logo, your home page is displayed.
Linking from Text
The following document contains links. When you hover the cursor over any revenue data, the hand pointer is displayed to indicate that the text is linked to another document or to a report.
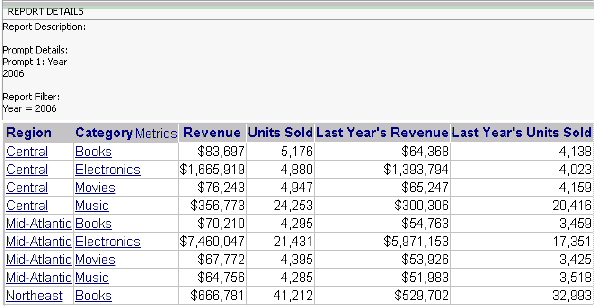
The complete document is not shown; the full document contains data for all regions and all categories.
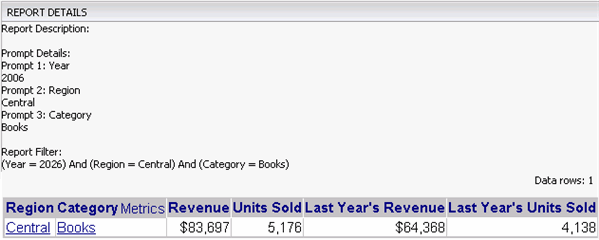
Click the down arrow ![]() to display a list of links, and click the link to open. In this example, the link is named Last Year Comparison, and displays the following, with data for the selected Region (Central), Category (Books), and Year (2011).
to display a list of links, and click the link to open. In this example, the link is named Last Year Comparison, and displays the following, with data for the selected Region (Central), Category (Books), and Year (2011).
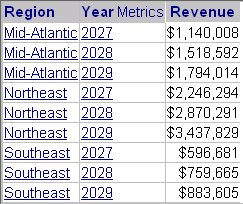
The column headers in the document are also linked. If you open the link on the text 2011 Revenue instead, the following report is displayed. It is the same report as the previous one, except that it contains all regions and all categories. (Only a portion of the report is shown below.)
Linking from an Object in a Grid or Graph
The following document links the Region attribute in the grid to a report called Revenue Rank with Region prompt. The links are indicated by the underlined region names. When you hover over a region, the hand pointer appears and the name of the link is displayed in a tooltip, as shown below.

When you click Southwest, the Revenue Rank with Region prompt report is displayed, as shown below. (This report is reproduced in its entirety.) Notice that only employees in the Southwest are included in the report.

This is because the Revenue Rank with Region prompt report includes a prompt on region. The document designer has created the link so that the link answers the prompt with the object selected in the source (Southwest in this case).
Metrics can also be linked to documents and reports. Linked metrics are displayed in the grid with an underline.
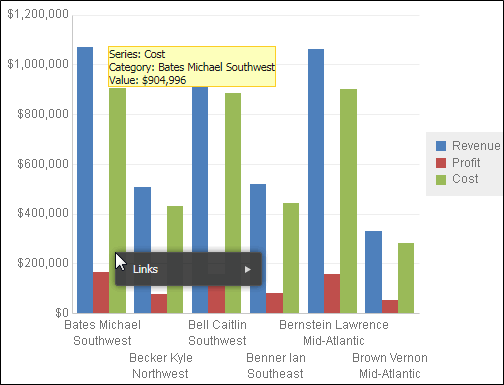
If the same report is displayed as a graph, you can right-click a bar in the graph to access the list of links, as shown below. If you selected the Revenue rank within region link, the same report as shown above would display. Southwest would be the only region displayed, because you clicked a Southwest bar in the graph.
Related Topics
How Links, Drilling, and Selectors Work Together
