Strategy One
Introduction to Report Services Documents
A Strategy Report Services document displays your organization's data in a format that is similar to a PowerPoint presentation, where several grid and graph reports can be viewed at the same time, along with images and text. High-quality, Pixel Perfect documents allow you to display your business data in a user-friendly way that is suitable for presentation to management for boardroom-quality material. Examples of documents include scorecards and dashboards, managed metrics documents, production and operational documents, and more.
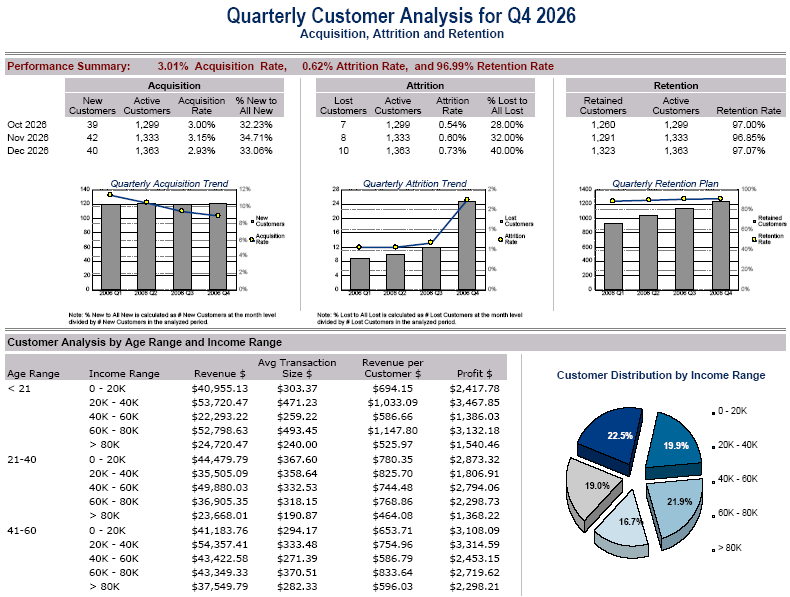
The sample scorecard shown below is the Quarterly Customer Analysis document, which shows trends in customer acquisition, customer attrition, and customer retention. The document also displays customer demographics such as income range and age range.

This document helps you visualize changes in trends that have occurred during a selected time period, as well as any related impact on revenue. Customer managers can use this report to get a general overview of trends within the customer base, as well as the mix of customers that make up the customer base. The report data can be used to develop potential opportunities for greater revenue, as well as actions to prevent a potential drop in sales.
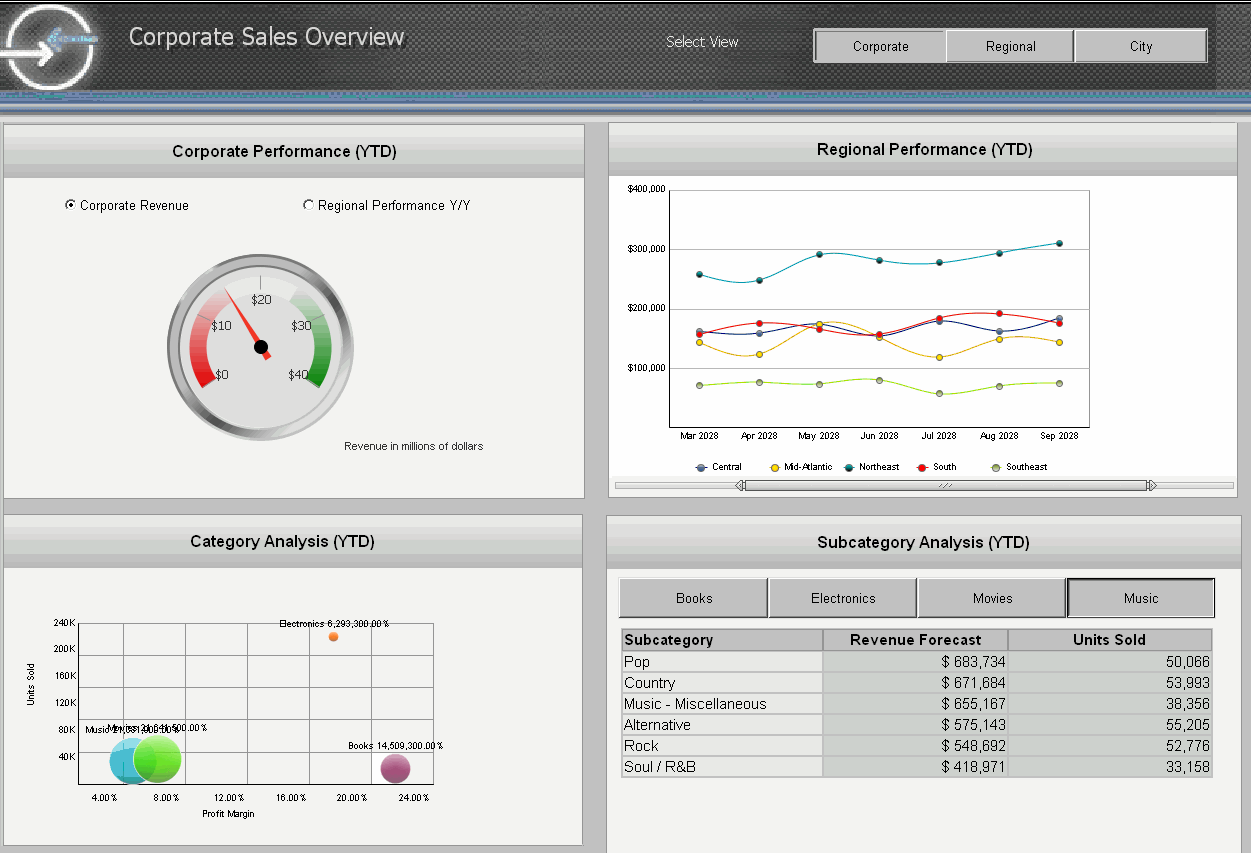
A dashboard-style document is a special type of document. It is commonly only one page long, is intended to be viewed online, and usually provides interactive features that let analysts change how they view the document's data, as well as what data they are viewing. A broad selection of widgets and a wide variety of formatting options allow you to design a customized, interactive dashboard-style document, as shown in the example below:

Documents provide the freedom to design pixel-by-pixel in multiple editing and previewing modes. The abundant design options deliver full control over position, formatting, and interactivity.
Related Topics
Run and View a Report Services Document
Answering Questions for a Prompted Document
