Strategy ONE
Import Visualizations
Starting in Strategy One (August 2025), use easy selection to easily select visualizations to import.
Starting in Strategy One (July 2025), you select multiple visualizations to import.
Starting in MicroStrategy ONE (June 2024), you can customize the import experience withImport Settings and Page-by Settings.
Starting in MicroStrategy ONE (March 2024), the Strategy for Excel add-in enables you to import data from dashboards as a visualization.
- Connect to the Strategy for Office add-in. Strategy for Office opens in a side panel.
- Select a starting cell.
- Click Import Data.
- The import window appears which allows you to browse content in the Library Web view, where you can select source objects from the smart view or Content Discovery.
- Select a dashboard and click Import.
- Navigate to the desired page and adjust filters, if needed.
-
Starting in Strategy One (August 2025), optionally toggle on Easy Selection to select a visualization in any place, not just in the checkbox.
To deselect a visualization in Easy Selection mode, click the visualization again.
- If Easy Selection is toggled off or unavailable, select the check box next to your visualization(s).
-
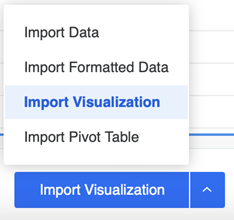
Click Import Visualization or choose Import Visualization from the drop-down.

-
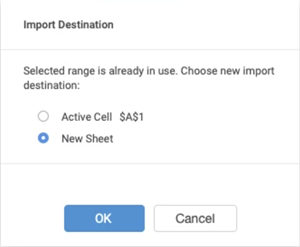
If the selected cell range is unavailable, the Import Destination dialog appears asking you to select a new destination for your data. Select one of the following two options:
- Active Cell: Select a cell in the sheet where you want your data to be imported.
-
New Sheet: A new sheet containing your data will be created.

-
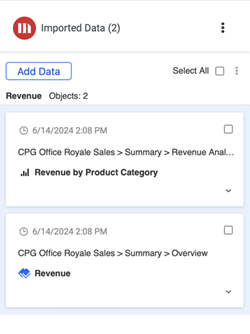
Imported objects display on the add-in side panel.
Starting in MicroStrategy ONE (June 2024), imported content displays on the side panel based on the Excel sheet placement to support simplified content tracking.

-
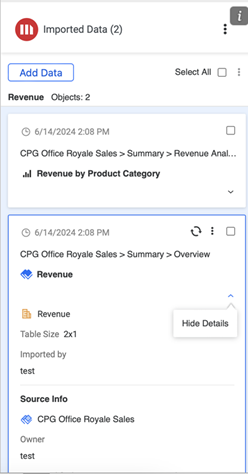
If you click an imported object, it becomes highlighted in the worksheet.
You can also view your data's imported object and source details by expanding the Show Details drop-down.

