Strategy One
Create Reports in Library Web
Starting in Strategy One (February 2026), you can Create a Report Based on a Cube.
Starting in Strategy One (December 2025), you can apply a theme to update multiple formatting settings at once. A theme, which you create in Workstation, is a predefined grid format. Theme formatting includes:
-
Template Style and Color
-
Banding
-
Merge Row and Column Headers
-
Spacing
-
Cell formatting for All, Both Axes, Rows, Columns, and All Metrics
The formatting applied to a specific object is not saved in a theme.
Starting in Strategy One (November 2025), you can base a report on a template. A report template defines the layout of general categories of information in a report. In a report template, you specify the information that you want to retrieve from your data source and the way that you want the data to display. A report template can also include filters. Use templates to simplify report creation and ensure consistency among reports. For steps to create templates, see Designing a Report's Structure: Report Templates.
Starting in the MicroStrategy 2021 Update 8, the ability to create and edit reports is shipped out-of-the-box.
Starting in MicroStrategy 2021 Update 7, administrators can enable authoring of reports in Library Web. This preview feature allows users to create and edit reports. The Report Editor also includes an Advanced Properties panel, SQL view when report execution is paused, more formatting options, customized subtotals, and support for transformations, consolidations, and custom groups, on top of the functionality available from previous releases. Use the Advanced Properties panel to set VLDB properties that determine joins, null display, and pre/post SQL statements, among others.
To enable this preview feature, see Enable Reports in Library Web.
Preview features are early versions of features and are not to be used in a production environment as the core behavior remain subject to change between preview and GA. By selecting to expose preview features, you can access these features and use them as you would any other functionality. The official versions of preview features are included in subsequent releases.
Check out the video below to learn more!
To create a report based on a template, you must have the following:
-
Create Report privilege
-
Browse and Execute permissions for the template file
Create a New Report
-
In the Library toolbar, click Create New
 and choose Report.
-
If you are connected to multiple projects, select the project to create the report in.
-
Beginning in Strategy One (November 2025), you can select a template for the report. Do one of the following:
-
To begin with a blank report instead of a template, click Blank Report to immediately open Edit mode. (If Blank Report is not displayed, your administrator has disabled the blank template. You must select another template.)
-
To begin with a template, click the template, select the data mode from the View Report In drop-down list (beginning in Strategy One (March 2026)), and then click Create to open the template in Edit mode. For steps to create a report based on a template, see Create a Report Based on a Template.
A blank report displays in Edit mode, with data retrieval paused for improved performance when working with large datasets. When data retrieval is paused, results do not display. To see the results, click Resume Data Retrieval
 . To pause data retrieval, click Pause Data Retrieval
  .
. -
-
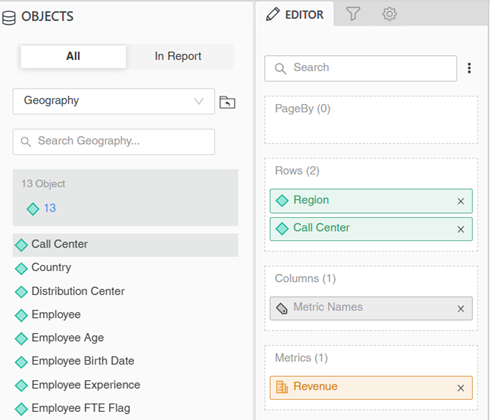
In the Objects panel, search for or navigate to each of the objects to display on the report and do one of the following:
-
Drag it to the drop zone in the Editor panel where you want it to display.
-
Double-click the object to add it automatically.
Attributes are automatically added to the rows of the report, although you can drag and drop them into the columns.
Metrics are automatically displayed in the columns and placed in the Metrics drop zone of the Editor panel.
or
Starting in Strategy One (January 2026), you can use the Workstation window including the Projects, Objects, Global Search, Report Editor, and more pages to add objects to your report. Find the objects you want to add to the report, click and drag the object to the drop zone in the Editor panel where you want it to display.
-
-
When you add a metric, the Metric Names object is automatically created and displayed in the Columns drop zone. This object determines where and how metrics display.
-
To display each metric in a column, with the metric name as the column header, keep the Metric Names object in the Columns drop zone.
-
To display each metric as a row, with the metric name in the row, drag Metric Names to the Rows drop zone.
-
-
Filter the report to ensure that it contains the correct data and focuses on your intended analysis. To filter the report:
-
Click Filter
 to display the Filter panel.
-
To use an existing filter, search for or navigate to an existing filter in the Objects panel. Drag the filter to the Filter panel.
-
To create a new filter within the report, in the Objects panel, search for or navigate to the object to filter the report by. If the report already contains the object, click In Report to view the objects on the report. Drag it to the Filter panel. Define the filter condition, such as Region = Northeast or Revenue Greater than 1,000. Click Done.
-
If data retrieval is active, click Apply.
For more detailed steps to filter the report, including the difference between report filters and view filters, see Filtering Reports.
-
-
To see the report results, in the toolbar, click Resume Data Retrieval
. -
When data retrieval is resumed, you can display subtotals. For quick subtotals at each attribute level of the report, right-click an attribute header and select Show Totals. Select the Total check box, leaving Applied Level at By Position. Click Done.
For example, a report contains the Category and Subcategory attributes. When you display subtotals by position, a subtotal is calculated for each category, as well as a grand total. The last two categories of the report are shown below.
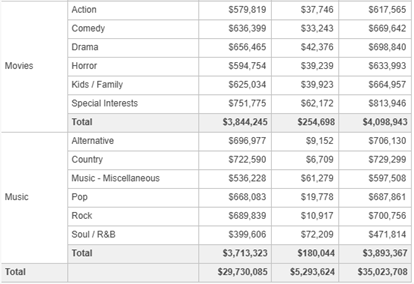
For steps to display other subtotals, see
-
Beginning in Strategy One (April 2025), you can undo and redo actions as you create and edit the report. For example, you can remove an object that you added to the report, undo a change to the number format, or undo a page-by selection.
-
When you click Resume Data Retrieval
or Pause Data Retrieval or add or adjust a report or view filter, you cannot undo or redo previous actions. Once you make another report manipulation, the Undo and Redo buttons are enabled again.
Format the Report
-
-
Click the Themes icon
 to display the Themes panel, which shows the currently applied theme and the theme gallery.
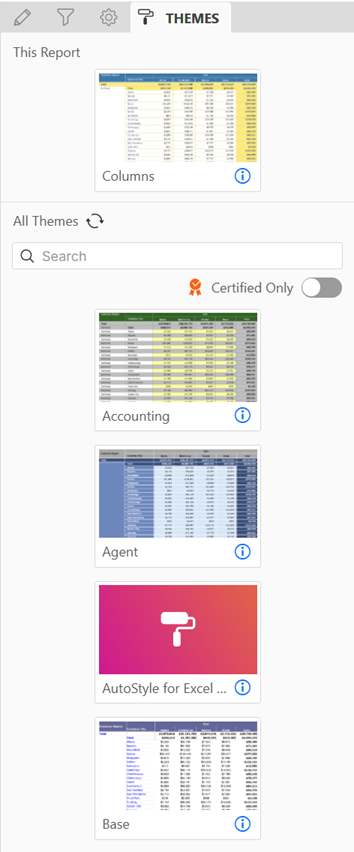
-
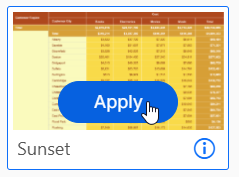
In the Themes panel, hover your cursor over the new theme and click Apply.
-
You can manually change any formatting. Changes apply to this report only; they do not update the theme. You can always remove those formatting changes and return to the full theme by re-applying the theme.
-
Format the report, including banding, outline, spacing, headers, values, and subtotals. Click Format
 to display the Format panelFormat panel.
Save the Report
-
Click Save.
-
Type the report's name in the Save As box.
-
Navigate to the location to save the report in.
-
Click Save.
-
After you save, data retrieval is again paused.
Starting in Strategy One (December 2025), you can apply a theme to update multiple formatting settings at once. A theme is a predefined grid format.