Strategy One
Create a Level Metric Within a Dashboard
By default, metrics in a dashboard are calculated at the level of the attributes in the visualization that they are used on; this is referred to as the visualization level. A level metric is a metric that is evaluated at a defined attribute level, regardless of what is contained on the visualization that they are placed on. Level derived metrics can calculate the metric at a higher level than the attributes on the visualization, to provide totals or contribution metrics, which determine the contribution of one object to the whole.
For an example of a level metric, and more detailed descriptions of the settings, see Introduction to Level Metrics.
Visualization Level: Adapting to Visualizations or Calculating Values for the Attribute Level Only
The visualization level allows the metric calculation to adapt to the visualization that it is placed on. If the Revenue metric is placed on a grid visualization containing Region, that attribute affects the metric calculation, along with the level explicitly set on the level metric. If you put the same metric on a report with Customer, that attribute, as well as the metric level, is used in the metric calculation.
If you remove the visualization level, only the level set on the metric affects the metric calculation, regardless of what a visualization contains.
Dynamic Level: Adding Flexibility with Attribute Location
Instead of specifying an attribute to use in the metric calculation, you can add more flexibility with dynamic levels such as columns or grand total. This means that the attributes in the specified location determine the level attribute. These types of level metrics are useful for as a part of contribution metrics. On their own, they are useful in bar graphs, to allow you to quickly and flexibly compare different values.
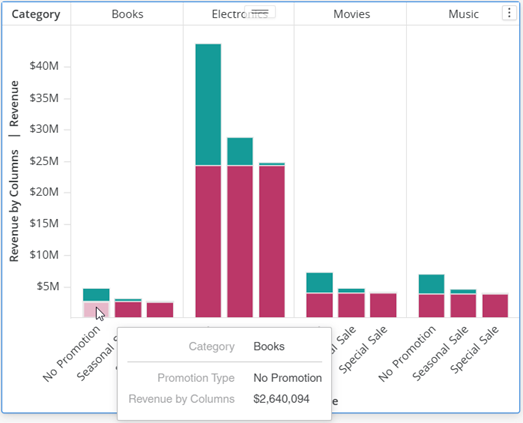
A stacked bar graph displays Revenue and Revenue by Columns metric values in the same bar. The Revenue by Columns metric is a level derived metric that calculates values by column. Each bar represents a Category and a Promotion Type combination, such as Books-No Promotion and Books-Seasonal Promotion.
Category is in the top column of the bar graph, so the Revenue by Columns metric calculates category values. You can easily see that Revenue by Columns metric values are the same within each category; the red portion of the bars representing them are the same height in each category. The Revenue metric values differ for each bar; the green portion of the bars representing them are all different heights.
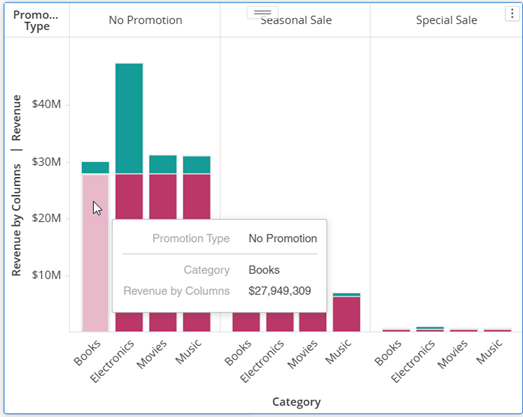
If you swap the Promotion Type and Category attributes, so that Promotion Type is now the top column, the Revenue by Columns metric values calculate a different value for each Promotion Type.
To Create a Level Derived Metric
- In a dashboard, create a derived metric.
- By default, the first level is set to the Visualization Level. Do not change this, unless you want:
- To calculate values for the target attribute only, as described above. Select the attribute to use for the calculation in the first drop-down list in the Level area, replacing Visualization Level.
- To use a dynamic level, as described above. Select the level such as By Columns or By Rows, in the first drop-down list in the Level area, replacing Visualization Level.
- To specify an attribute level instead, in the second drop-down list in the Level area, select the attribute to use for the calculation. This part is also referred to as the target attribute of the level.
- To change the filtering and aggregation behavior of the level metric, click the menu icon
 next to the Level drop-down list.
 - The Relationship with Report Filter setting determines how the report filter affects the metric calculation. The default is Standard, which means that only data that meets the conditions in the filter is included in the metric calculation. Other options are:
- Absolute, which raises the level of the filter to the attribute level before applying the filter.
- Ignore, which ignores any conditions in the filter that are based on the attribute level.
- None, which allows the attribute level and aggregation setting to define how the filter is applied.
- The Metric Aggregations setting determines how the metric is grouped, or aggregated, when displayed on a visualization. The default is Standard, which groups data by the attribute level.
- You can change it to None, which excludes the attribute level from being used to group data. This can be used to calculate a grand total.
- The remaining options are used for nonaggregatable metrics, such as inventory metrics.
- The Relationship with Report Filter setting determines how the report filter affects the metric calculation. The default is Standard, which means that only data that meets the conditions in the filter is included in the metric calculation. Other options are:
- You can add multiple attribute levels to the metric.
- Click Save.