Strategy One
Copy and Paste Visualization Formatting
Starting in MicroStrategy ONE Update 11, Application Architects can copy visualization formatting and paste it on other visualizations. The available formatting includes default font type and size, fill color, and other formatting properties in different visualizations or component types.
Copy and Paste Visualization Formatting Using Visualization Menus and Shortcuts
- Open a dashboard.
- To copy a visualization, use one of the following methods:
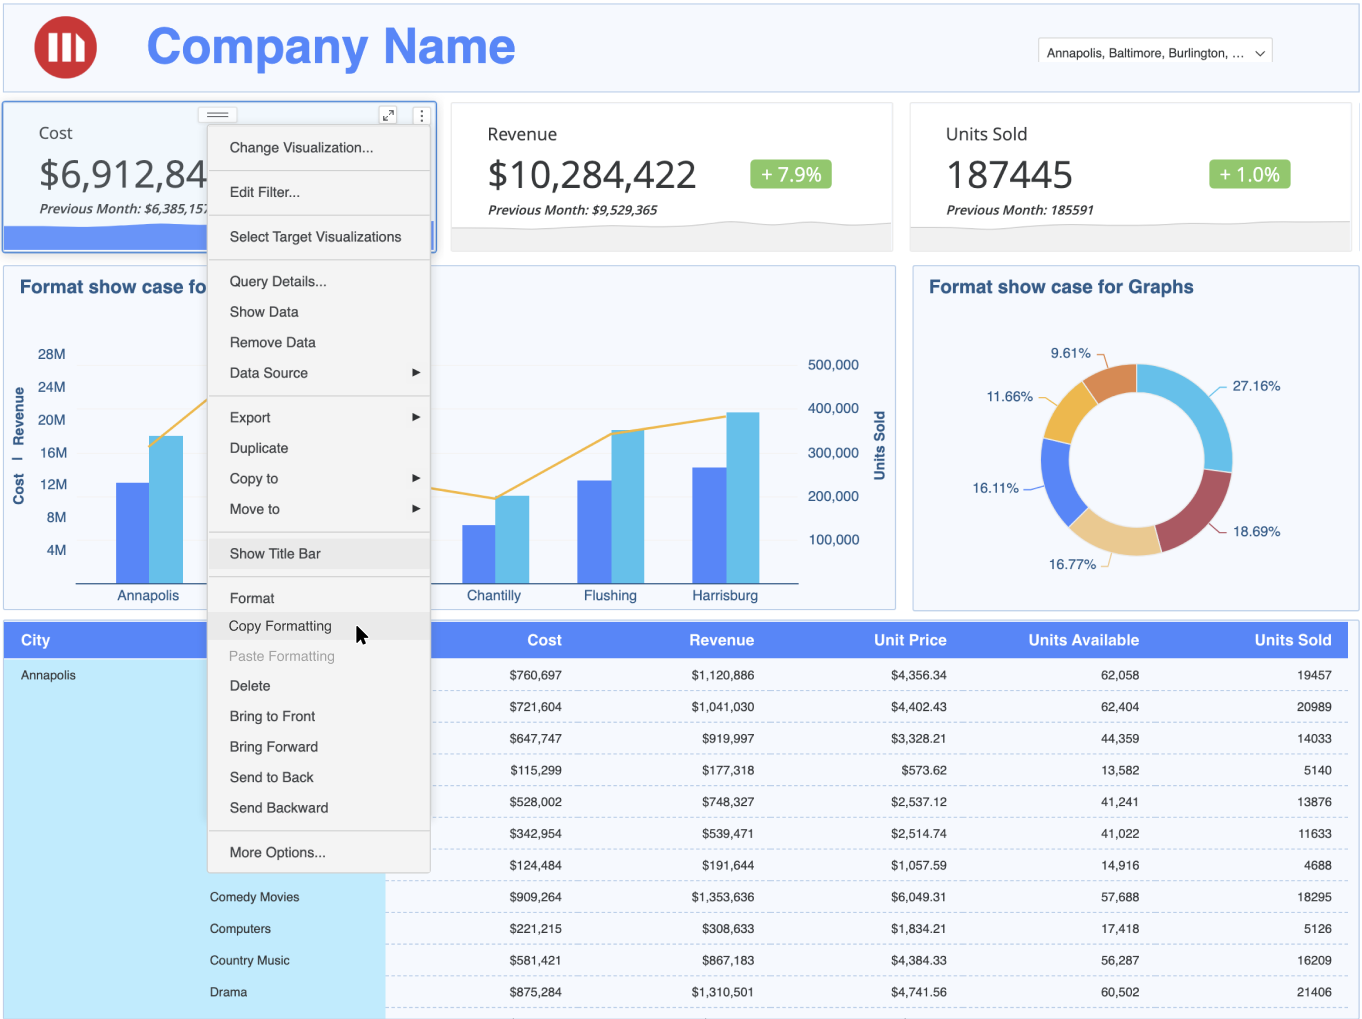
- Click More
 in the upper right corner of the visualization and choose Copy Formatting.
 - Right-click a visualization and choose Copy Formatting.
- Select a visualization and click Ctrl + Shift + C.
- Click More
- To paste a visualization, use one of the following methods:
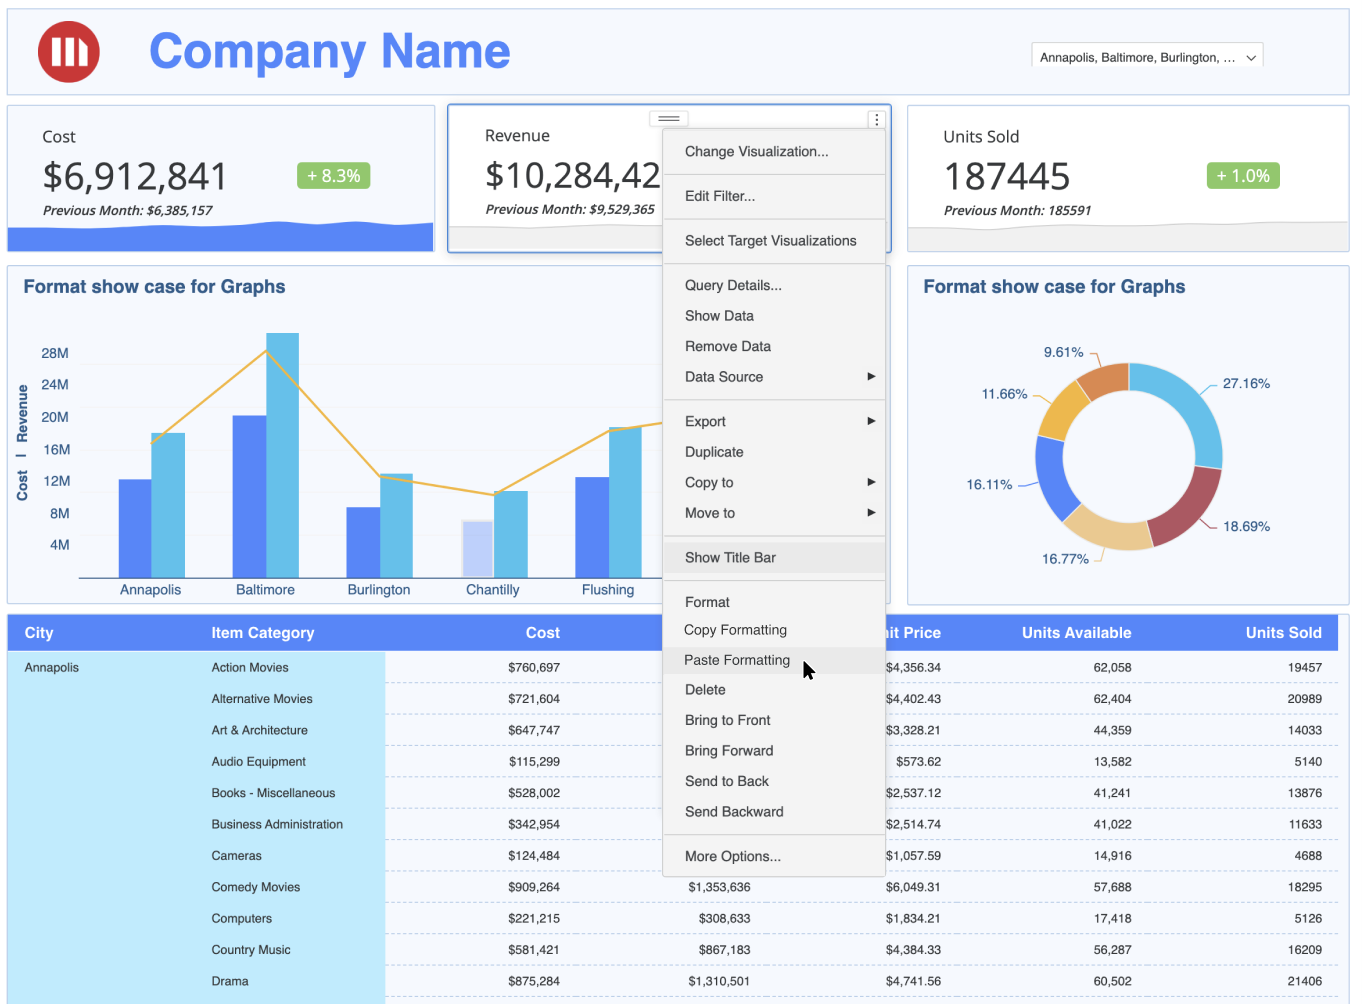
- Click More
 in the upper right corner of a different visualization and choose Paste Formatting.
 - Right-click a visualization and choose Paste Formatting.
- Select a visualization and click Ctrl + Shift + V.
- Click More
Copy and Paste Visualization Formatting Using the Layer Panel
- Open a dashboard and open the layer panel.
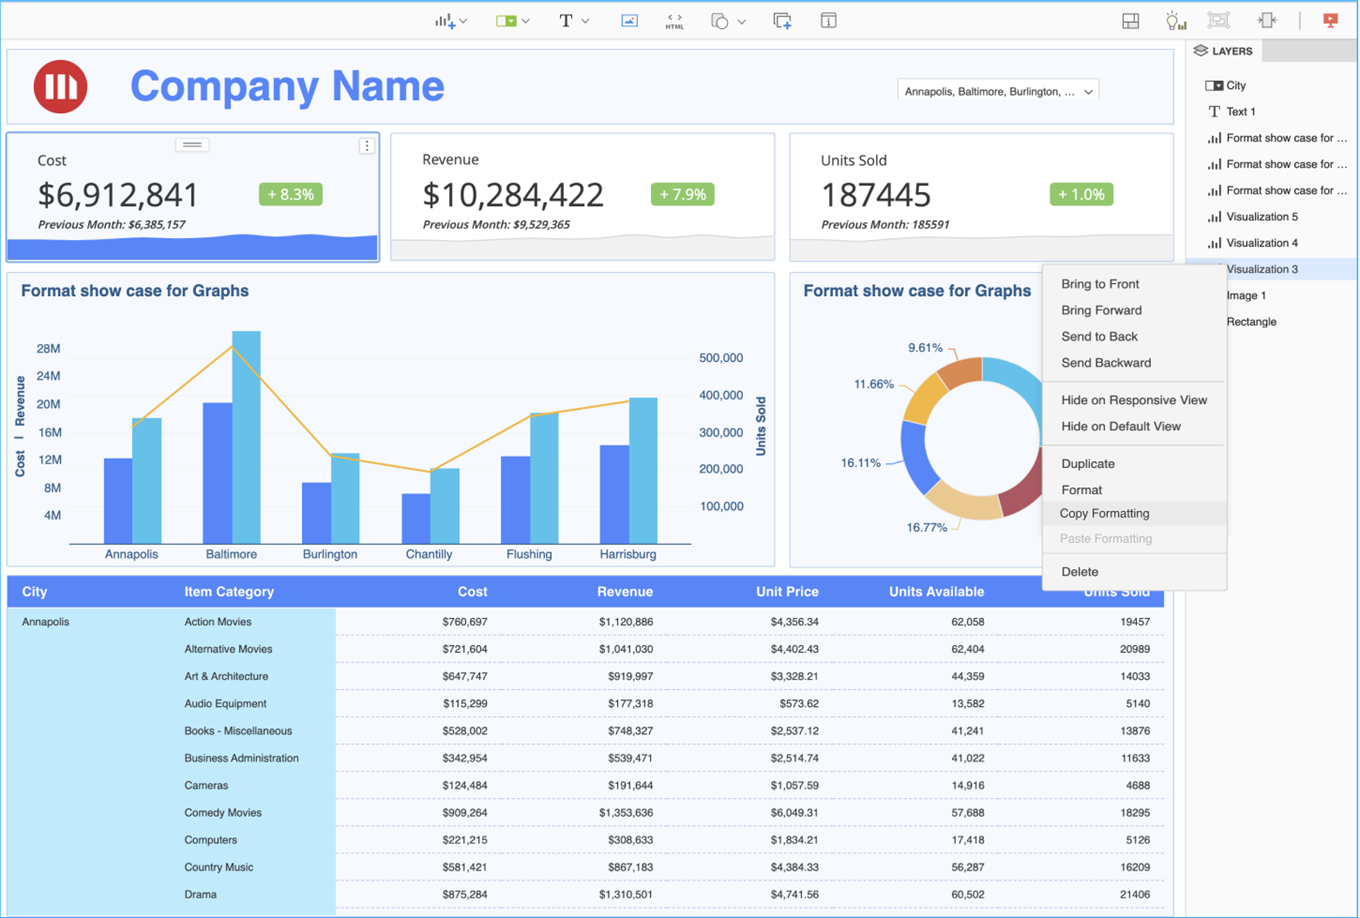
- Right-click a visualization in the layer panel and choose Copy Formatting.
- Right-click a different visualization in the layer panel and choose Paste Formatting.
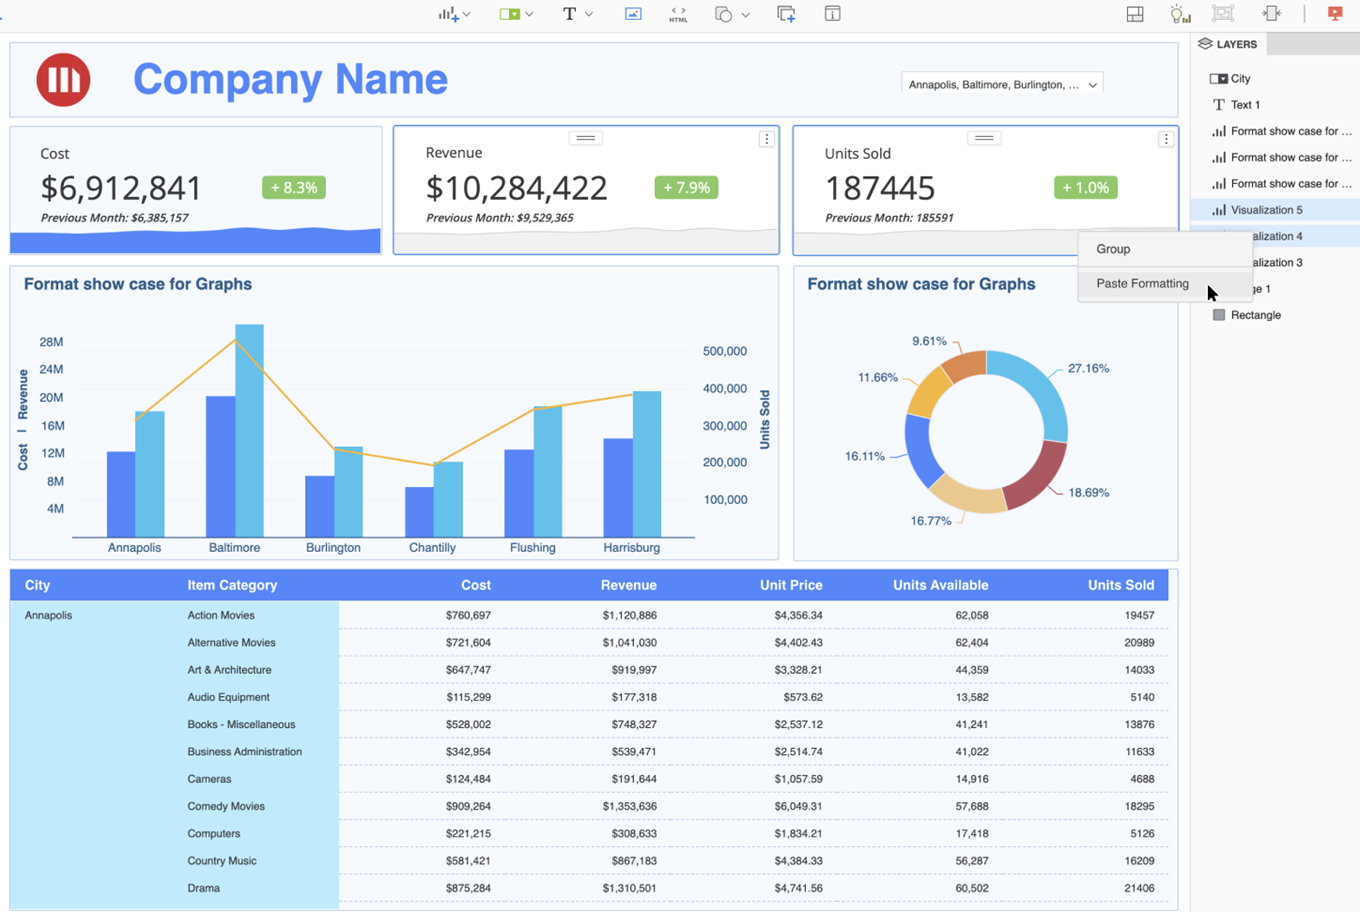
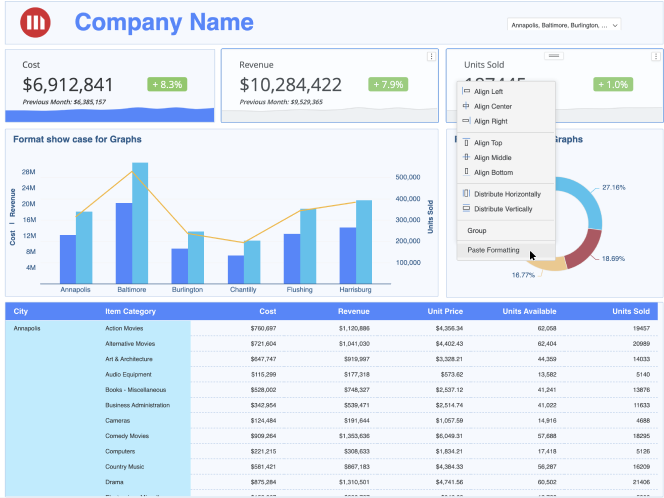
Select Multiple Visualizations to Paste Formatting
- Click Ctrl + left-click on each visualization that you want to apply formatting to.
- Right-click on one of the selected visualizations and choose Paste Formatting.
Supported Visualizations and Formatting
The following visualizations only support copy and pasting properties in Text and Form and Title and Container in the Format panel. Visualizations not included in this list support copy and pasting properties in Title and Container in the Format panel.
If visualizations are not the same type, only the Title and Container properties in the Format panel can be copy and pasted.
Supported Visualizations:
- Grid
- Graph
- Bar
- Line
- Area
- Combo
- Bubble
- Pie
- KPI
- Multi-metric KPI
- Comparison KPI
- Gauge
- Geospatial Service
- Map
- Heatmap
- Waterfall
- Box Plot
- Network
- Histogram
- Sankey
- Time Series
Supported Components:
- Filter
- Text
- Image
- HTML Container
- Shape
- Panel Stack
Supported Format Properties:
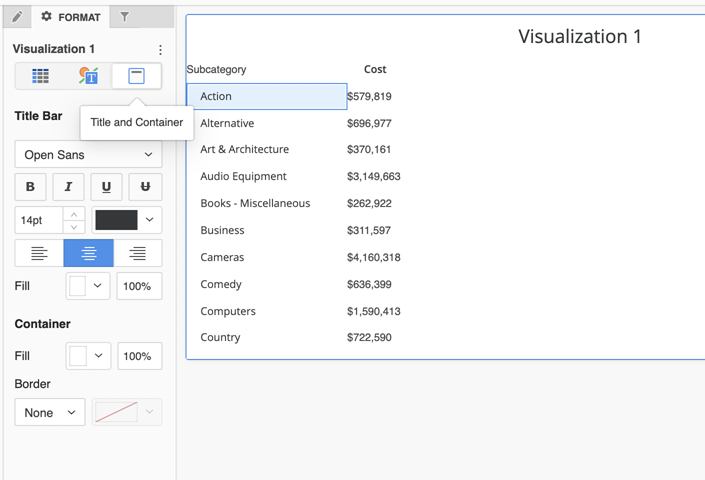
All properties in the Title and Container format panel are supported except for the toggle title bar status.
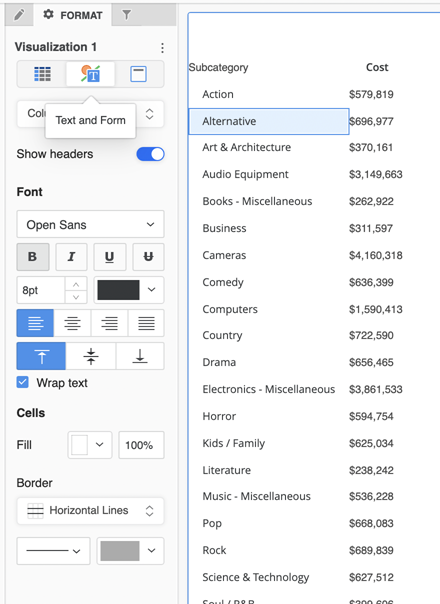
All properties in the Text and Form format panel for visualizations and components are supported except for Reference Line, Trend Line, Color By, and any toggles such as Data Labels.
Visualizations Options in the format panel are not supported.
