Strategy One
View Environment Topology and Monitor Services
Administrators can view the topology of all nodes and services within a connected environment, as well as monitor, start, and stop the corresponding services. See the Installing and Configuring Topology section of the Installation and Configuration Help for more information on installing and configuring topology.
- Open the Workstation window with the Navigation pane in smart mode.
- In the Navigation pane, click Monitors.
- Select an Environment from the upper-left drop-down.
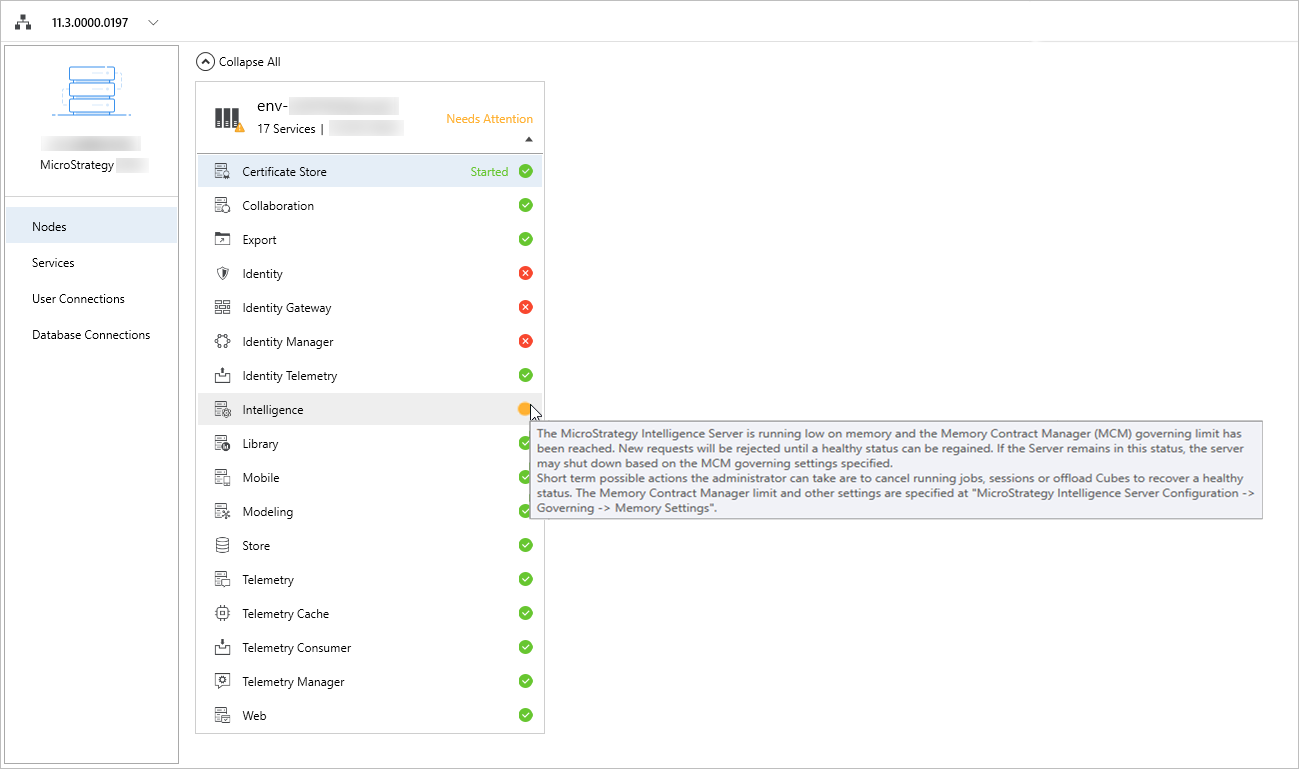
- In the left panel, click Nodes or Services to display environment information by node or service.
-
In the Nodes section, click on each node to expand it and view all of the services. Right-click a service to choose whether to Stop or Start it. A red circle
 appears next to a stopped service. A green circle
  appears next to a running service. A yellow circle
  appears next to a partially stopped service. A blue rotating circle
  indicates a transitory starting or stopping state, and is intended for services (e.g., Intelligence Server) that can have a long transitory period. A warning
  icon appears next to nodes that contain a stopped service.
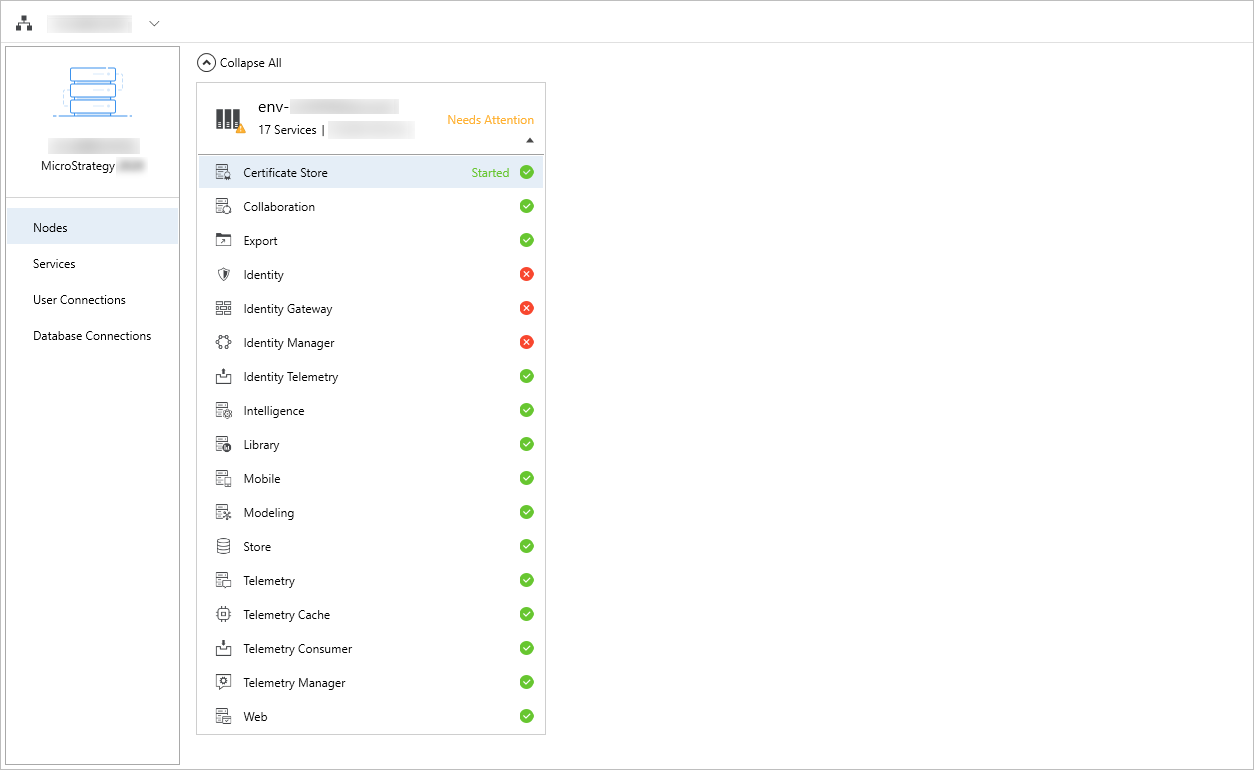
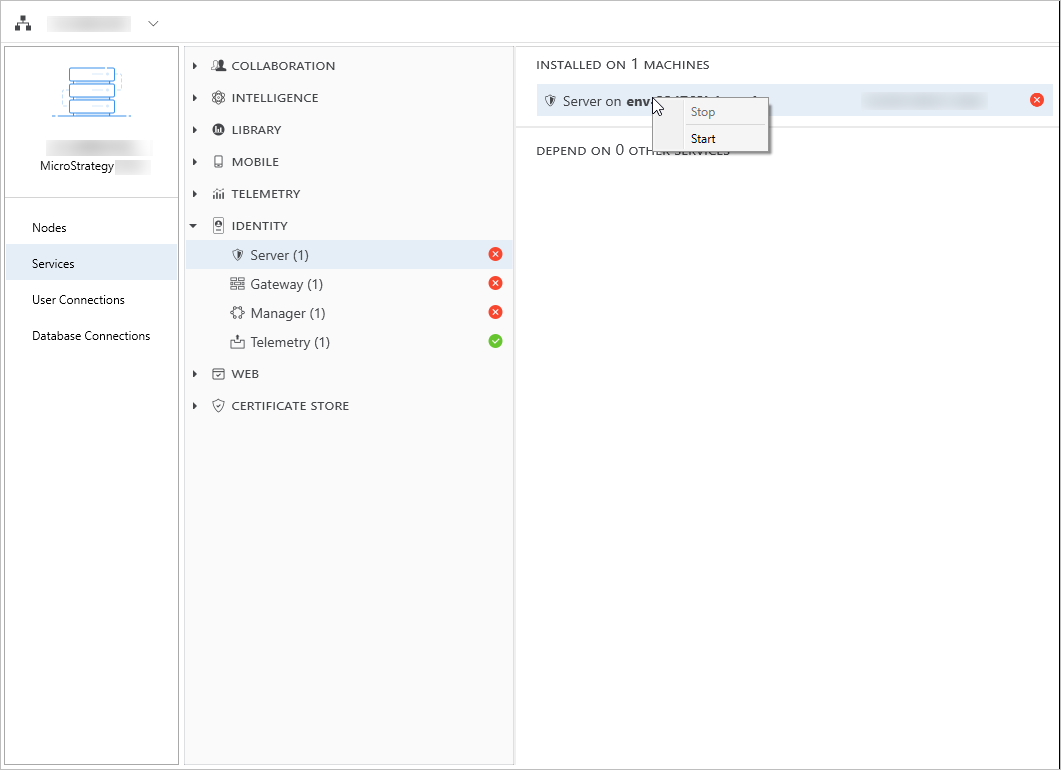
- In the Services section, expand service types in the left pane to locate the services you want to monitor. Click on a service to view it in the right pane, along with any services that it depends on to run. In the right pane, right-click a service to choose whether to Start or Stop it.
-
For any service in a non-running state (with a status icon other than a green circle
), a text box with a detailed description will appear when the mouse cursor is placed over the status icon. The description is case by case based on the actual cause. For example, a yellow circle on Intelligence Server service can be caused by a low available memory state.