MicroStrategy ONE
Understanding the parts of a document
The sample document below is displayed in PDF View. The parts of the document are described below the image.
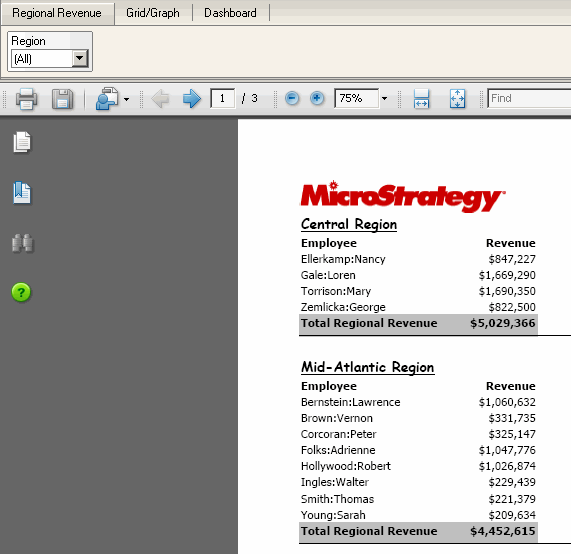
Displaying data in the document
Most of the information on a document is from an underlying dataset. A dataset is a MicroStrategy report that defines the data that the Intelligence Server should retrieve from your data warehouse or from a cache that is available to the document. In the document sample above, the employee names and the revenue amounts are retrieved from the dataset report. As an analyst, you do not see the underlying dataset reports that provide the data; you see the data itself instead.
Other information that does not originate from the dataset is stored in the document's definition. In the document sample above, for instance, the words "Employee" and "Revenue", as well as the MicroStrategy company logo, are not part of the dataset report.
For more information on working with datasets, see Accessing data in a document: The dataset report.
How metrics are calculated in a document
A metric is calculated differently depending on its location in the document. For example, the Revenue metric next to each employee is calculated at the level of the employee. The same Revenue metric next to the text "Total Regional Revenue" calculates all the revenue for the specific region.
The end of the sample document was not included in the previous image; below you can see the total revenue for the entire document. The same Revenue metric was used, but because of its location in the document it calculates as a grand total.
For more information on metrics in documents, see Working with metrics in documents and Metric calculation in documents.

Hyperlinks
A hyperlink connects text or an image in a document to a web page (the target of the hyperlink). When the document is open in PDF View, the cursor changes to a hand when you hover the cursor over text that contains a hyperlink.
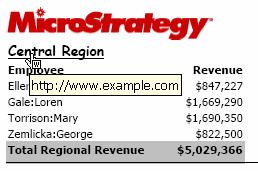
Click the hyperlink text to open the target in another window. Hyperlinks are functional in PDF View in MicroStrategy Developer, as well as in Express Mode, Interactive Mode, and Editable Mode in MicroStrategy Web.
If text is underlined but the cursor remains a pointer, the text is a link, which is functional in MicroStrategy Web, not MicroStrategy Developer. For more information on links and hyperlinks, including examples and a comparison of the two features, see Linking from documents.
Grouping documents to create pages of data
If a document is organized so that the data is grouped by page, drop-down lists are displayed at the top of the screen. You can select which elements, or subsets of data, to display. Each subset of data is called a page. The document sample at the top of this topic displays all regions.

Pages result from a document designer creating groups on the document. Grouping information together helps people who read the document to understand the data better.
For more information on grouping and paging, see Grouping records in a document and Using page-by on a document.
Layouts
A multi-layout document contains multiple documents, each in its own layout, creating a "book" of documents. Each layout functions as a separate document, with its own grouping, page setup, and so on, but the layouts are generated into a single PDF document. If a document contains multiple layouts, tabs are displayed at the top of the screen. Click a tab to select which layout to display.
The sample document at the top of this topic displays the Regional Revenue layout. Click the Grid/Graph tab, and that layout is now displayed, as shown below.
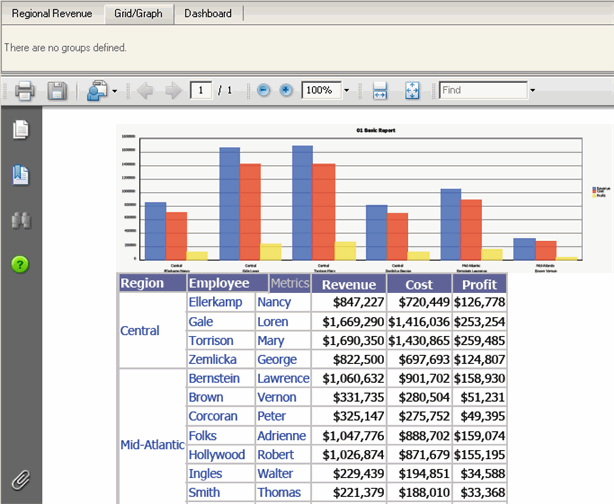
When you export a multi-layout document to Excel, each layout is placed into a separate worksheet of the spreadsheet (see Exporting documents to Excel for instructions). When you export a multi-layout document to a PDF file, each layout starts on a new page (see Exporting documents to PDF files for instructions).
For more information on layouts in documents, see Creating multi-layout documents.
Displaying reports on documents: Grid/Graphs
A Grid/Graph is the object used to display MicroStrategy reports on documents. Like a report, a Grid/Graph can be displayed as a grid, a graph, or both:
-
Grid: displays the Grid/Graph as a standard MicroStrategy grid with rows and columns of attributes and metrics, as shown below.

-
Graph: displays the data visually like a standard MicroStrategy graph. The same Grid/Graph is shown below as in graph view.
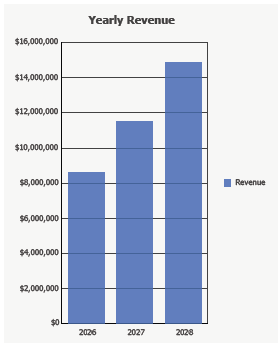
-
Grid and Graph: displays both Grid and Graph views simultaneously. The same Grid/Graph is shown below in Grid and Graph view.
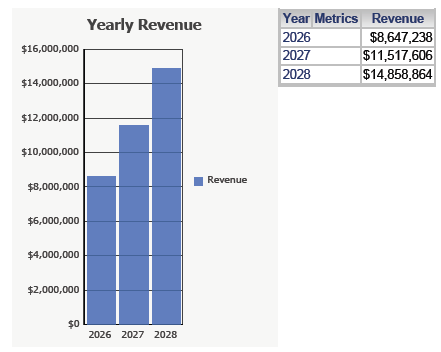
The data on the Grid/Graph comes from a dataset report, just as the attribute or metric data comes from a dataset report.
If the data in the dataset report changes (for example, new employees are added to the data warehouse), the data in the Grid/Graph on the document changes. However, changes, such as formatting the employee names, made to the MicroStrategy report are not propagated to the Grid/Graph in the document. If an object, such as the Employee attribute is removed from the MicroStrategy report, it cannot be displayed in the Grid/Graph in the document.
A special type of Grid/Graph, a shortcut, is linked to the MicroStrategy report. Grid/Graph shortcuts do reflect changes made to the MicroStrategy report.
For more information on Grid/Graphs, see Displaying reports in documents: Grid/Graphs. For information on shortcuts in particular, see Adding Grid/Graphs as shortcuts linked to reports.
Report Services (RS) dashboards
An RS dashboard is a special type of document, not a part of a document.
An RS dashboard is commonly only one page long, is intended to be viewed online, and usually provides interactive features that let analysts change how they view the RS dashboard's data. By being only one page long, an RS dashboard makes it easy to view the whole document at one time and see all the information. An RS dashboard allows interactivity from users, so each user can change how they see the data, within the limits of what the RS dashboard allows them. You must view an RS dashboard in MicroStrategy Web to be able to interact with its widgets, selectors, and panel stacks.
For instructions to analyze RS dashboards in MicroStrategy Web, see the MicroStrategy Web Help or the Document and Dashboard Analysis Guide. For descriptions of the various types of objects that are used in RS dashboards, and instructions to create RS dashboards, see Designing dynamic enterprise RS dashboards.
