MicroStrategy ONE
Providing Flash-based analysis and interactivity: Widgets
A widget is a Flash-based display of the results of dataset reports, allowing users to visualize data in different ways than traditional reports displayed as Grid/Graphs do. Widgets are sophisticated visualization techniques that can combine with rich interactivity to enable users to understand their data more effectively. You can use a variety of widget types, such as Gauge, Heat Map, and Stacked Area widgets, in Report Services (RS) dashboards. Although each type of widget looks different and is used in a unique way, the main purpose of all widgets remains the same: to provide document analysts with a visual and interactive look into their data.
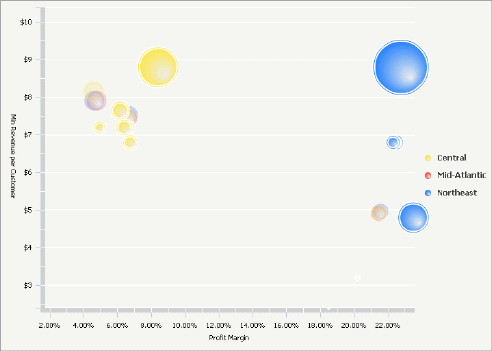
For example, the Interactive Bubble Graph widget below allows document analysts to drill into each bubble in the graph by clicking it. Analysts can also use the time animation toolbar at the top of the widget to watch the bubbles appear on the graph in chronological order.

For more information on Bubble Graph widgets in particular, including a detailed description of the data structure and a procedure to enable drilling, see Defining Interactive Bubble Graph widgets. For descriptions of all the different widgets that are available, see Understanding and working with widgets. For instructions to create a widget, see Creating widgets.
Widget interaction and display
Analysts can display and interact with the widget in MicroStrategy Web, MicroStrategy Developer, and MicroStrategy Mobile devices, as shown in the table below. For the Interactive Bubble Graph widget shown above, examples of interaction include drilling into bubbles, changing the color of the bubbles, and hiding the widget legend. Certain modes allow an analyst to save those changes, such as the bubble color and widget legend status.
|
View or Mode |
Widget Can Display As |
Interact with Widget? |
Save Widget Changes? |
|---|---|---|---|
|
MicroStrategy Developer |
|||
|
Design View |
Empty Grid/Graph (no data) |
N/A |
N/A |
|
Flash View |
|
Yes |
No |
|
HTML View |
|
N/A |
N/A |
|
PDF View |
|
N/A |
N/A |
|
MicroStrategy Web |
|||
|
Design Mode |
Empty Grid/Graph (no data) |
N/A |
N/A |
|
Editable Mode |
Grid/Graph |
N/A |
N/A |
|
Express Mode |
|
Yes |
No |
|
Flash Mode |
|
Yes |
Yes |
|
Interactive Mode |
|
Yes |
Yes |
|
MicroStrategy Mobile |
|||
|
Android |
Android widgets:
All other widgets are displayed as Grid/Graphs |
Yes (Android widgets only) |
No |
|
iPad |
iPad widgets:
All other widgets are displayed as Grid/Graphs |
Yes (iPad widgets only) |
No
|
|
iPhone |
iPhone widgets:
All other widgets are displayed as Grid/Graphs |
Yes (iPhone widgets only) |
No |
|
Exporting |
|||
|
Export to Excel |
|
N/A |
N/A |
|
Export to Flash |
|
Yes |
N/A |
|
Export to PDF |
|
N/A |
N/A |
|
* Except for SDK widgets and widgets for mobile devices. These widgets cannot be displayed as widgets in Flash View/Mode. ** Except for the following widgets, which cannot be displayed as widgets in Interactive Mode or Express Mode: Cylinder, Date Selection widget created as a selector, Fish Eye Selector created as a selector, Interactive Stacked Graph, Thermometer, and Time Series Slider. |
|||
For instructions to change how widgets are displayed in the various views and modes of MicroStrategy Developer and MicroStrategy Web, see Determining how widgets are displayed.
To view and interact with widgets, Flash Player version 10 is required.
Creating a widget in MicroStrategy Developer
To create a widget in MicroStrategy Developer, you must first insert a Grid/Graph into a document and add report objects such as attributes and metrics to it. Alternatively, you can drag and drop the name of a dataset from the Datasets pane to the Layout area. Each type of widget requires a specific number, type, and arrangement of report objects on the Grid/Graph that contains the widget.
-
For a description of the types of widgets available for documents, see Understanding and working with widgets.
-
For steps to add a widget to a document and define it, see Creating widgets. Each widget definition topic provides the specific number, type, and arrangement of objects that the widget requires.
Widgets and automatic target maintenance for selectors
Selectors allow a user to control what is displayed in a widget or Grid/Graph (the target of the selector). Targets can be automatically maintained in a layout. This means that when you add a Grid/Graph or widget, the Grid/Graph or widget automatically becomes the target of all selectors in the same panel or document section as the Grid/Graph or widget. For more information about automatically maintaining targets for selectors, including instructions to enable and disable the functionality, see Automatically maintaining targets for selectors.
Widgets for mobile devices
You can define a Grid/Graph to display as a widget on a document when the document is executed on a mobile device that has the MicroStrategy Mobile application. For examples of the widgets available for mobile devices, see Widgets for mobile devices.
You can also define a report to display as a widget when the report is executed on a mobile device that has the MicroStrategy Mobile application. You use MicroStrategy Web to create these widgets; for instructions and more information, see the MicroStrategy Mobile Analysis Help.
