Strategy ONE
Navigate Strategy Library
After adding items to your library, you can view them on the Library Home page.
Starting in Strategy One (July 2025), the Library Home page is enhanced so that it's quicker to find the content you need. The improved search experience helps you find content more efficiently. On the sidebar:
-
Recents and Favorites provide quick access to recently-viewed content and favorited objects.
-
Snapshots displays dashboards, reports, and (beginning in Strategy One (August 2025)) documents that were executed in the background, as well as snapshots created for dashboard subscriptions, document subscriptions, and report subscriptions. When you favorite a snapshot, it displays at the top of the Snapshots pane.
-
Bookmarks allows you to quickly find your dashboard, document, and report bookmarks, starting in Strategy One (September 2025). These include bookmarks that have been shared with you. When you favorite a bookmark, it displays at the top of the Bookmarks pane.
The display of sidebar components is controlled by your administrator.
Starting in MicroStrategy ONE (September 2024), the Library Home page is redesigned to simplify object browsing, ensure platform consistency, and improve filtering behavior. By streamlining the interface, filters handle tasks more effectively and align them with the search results page.
To access the Home page, click the Library icon ![]() in the top left corner of any dashboard, document, or report viewed in Library or enter the following in your browser:
in the top left corner of any dashboard, document, or report viewed in Library or enter the following in your browser:
https://HOST_NAME:PORT/MicroStrategy Library/app
Library Home Page
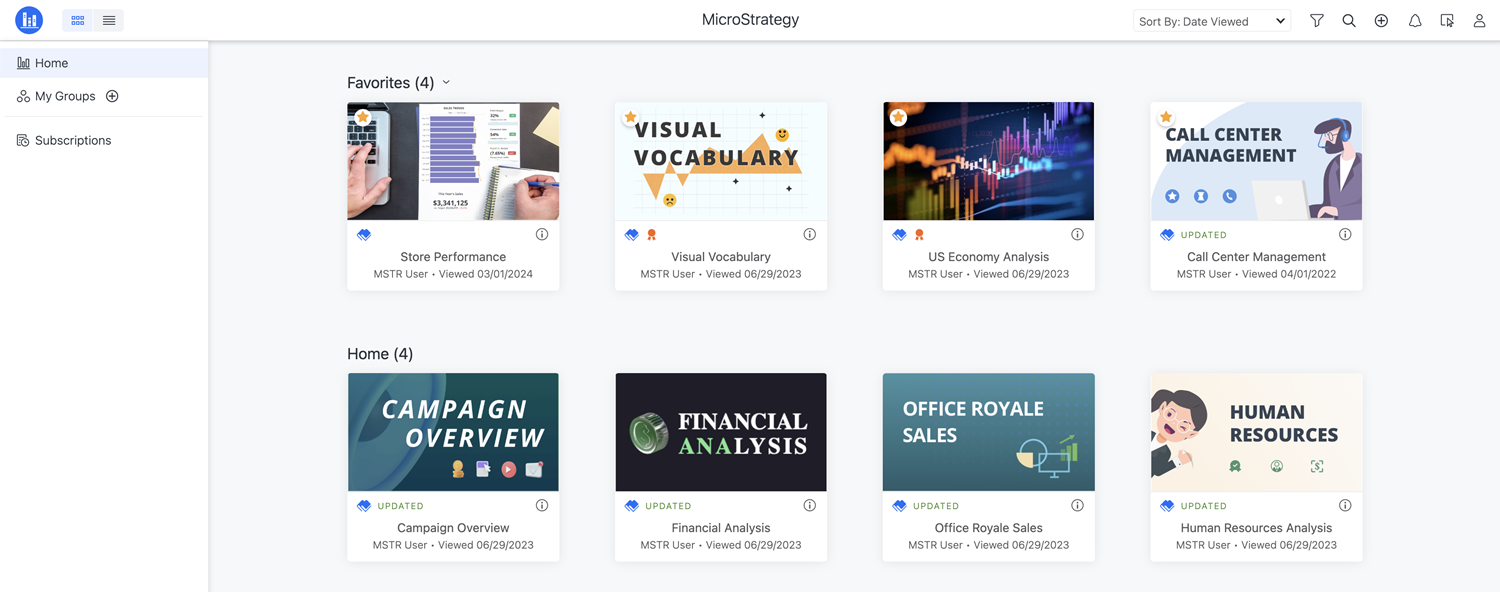
The Library Home page displays your saved dashboards, reports, and documents in a modern format as tiles with Grid View or as a list with List View, if enabled by an administrator. Here you can view your notifications, search for items, or select a dashboard, report, to interact with. Your administrator can select which components to display in the toolbar or can disable the toolbar.


Sidebar
View and navigate to the Home page, groups, and other environment-specific pages with the left sidebar menu. Your administrator decides which components to display in the sidebar.
Starting in Strategy One (November 2025), administrators can specify that the application uses Browse Folders as the home screen. When enabled, Browse Folders displays at the top of the sidebar.
Grid View displays dashboards, documents, and reports in a modern format as tiles. List View displays the objects in a compact, informative, and customizable format as a list.

Sort dashboards, documents, and reports by name, owner, date added, date updated, date viewed, certification status, or project to enhance overall organization.

Filter dashboards, documents, reports, and agents in your library by project, type, owner, status (new or updated), and certification.

Notifications
See who shared a dashboard or sent a comment on which dashboard in your library, and when it was sent. A red dot displays  when you have a notification.
Select content to add a custom group. The new group displays in the sidebar under My Groups.

View links to help or see a tutorial on navigating the Library Home page. Manage your library to remove objects, set your preferences such as language and time zone, and log out of Library.
See the following video on navigating Library:
Once you've explored the Library Home page, View Dashboards in Your Library.
Library Home Page
Once you open your Library, a list of saved dashboards, documents, and reports displays. Tap an object to view it, or use the icons to search, view notifications, or view your profile.
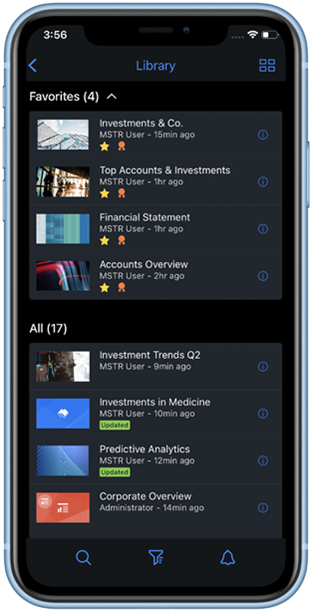

Use the Library sidebar to view other libraries or the following components, as chosen by your administrator:
-
Bookmarks (starting in Strategy One (September 2025))
-
Custom groups
-
Downloads
Displays PDF, Excel, and .mstr files
-
Favorites (starting in Strategy One (July 2025))
-
Recents (starting in Strategy One (July 2025))
-
Snapshots (starting in Strategy One (July 2025))
Displays dashboards, reports, and (beginning in Strategy One (August 2025)) documents that were executed in the background, as well as snapshots created for dashboard subscriptions, document subscriptions, and report subscriptions
-
Subscriptions

Account
The Account option appears in the bottom left of the sidebar menu. View app preferences, utilize advanced settings, and view links to Support or Legal.

Tap to view dashboards in a tile format. Tap again to return and view dashboards in a list form.

Sort and Filter
Select the sort order or filter your library by content type or status.

Search
Search globally on dashboards, chapters, pages, attributes, and metrics both inside and outside of Library.

Notifications
View who has shared a dashboard or sent a message on a dashboard in your library and when it was sent. A red dot displays  when you have a notification.
Starting in MicroStrategy ONE (December 2024), content groups in an application can be pre-cached. When you log into the application in iOS Mobile, the dashboards in content groups with pre-caching enabled download for offline use. You receive a notification indicating the download progress, which updates when the download completes.
Tile Format
Tap Tile to view the contents of your library in tile format or as a list.
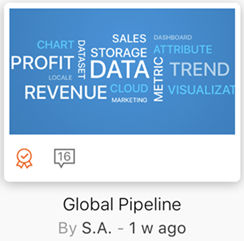
In tile format, you can see the name of the item, the author, and when the item was last updated or viewed. The icons on the item will vary depending on the status, certification level, and recent interaction.
![]()
New item
![]()
Updated item

Certified
![]()
Comments
Additional Information
Tap  to share, edit, refresh, or delete your dashboard. This screen also allows you to rename your dashboard, see the author, when it was last updated, and the number of comments. Tap the dashboards listed under Related Content to view similar data.

Download
Download the dashboard as an .mstr file.

Reset
Reset a dashboard.

Remove
Remove the dashboard from your library.

Share
Share a link to your dashboard from Library.
Once you've explored the Library Home page, View Dashboards in Your Library.
Library Home Page
Once you open your Library, a list of saved dashboards, documents, and reports displays. Tap the object to view it, or use the icons to search, view notifications, or view your profile.
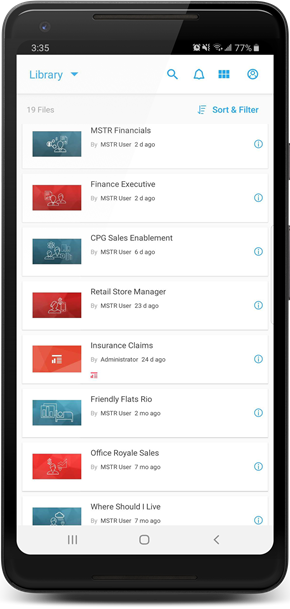

Use the drop-down list and tap the Folders tab to see dashboards exported to .mstr files or PDFs, or tap Libraries to view a different Library.

Search
Search for dashboards, chapters, pages, and owner names.

Notification
See who shared a dashboard or sent a comment on which dashboard in your library, and when it was sent. A red dot displays  when you have a notification.

Account
View links to support or legal, or utilize advanced settings. Use the Account tab to add a new Library. For steps, see Install and Configure Mobile App.

Sort & Filter
Change the sort order or filter your Library by dashboards or status.
Tile Format
Tap Tile to view the contents of your library in tile format or as a list.
In tile format, you can see the name of the item, the author, and when the item was last updated or viewed. The icons on the item will vary depending on the status, certification level, and recent interaction.
![]()
New item
![]()
Updated item

Certified
![]()
Collaboration

Information

Additional Information
Tap  to share, edit, refresh, or delete your dashboard. This screen also allows you to rename your dashboard, see the author, when it was last updated, and the number of comments. Tap the dashboards listed under Related Content to view similar data.

Download
Download the dashboard as an .mstr file.

Reset
Reset a dashboard.

Remove
Remove the dashboard from your library.

Share
Share a link to your dashboard from Library.

