Strategy ONE
Create a Forecast Analysis Line Chart
-
Open a dashboard for editing.
-
In the top toolbar, click

-
Choose Insight+ > Forecast Line Chart
 .
. -
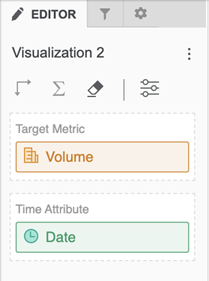
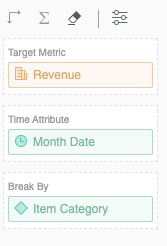
Drag a metric and time attribute from the Datasets panel to the Editor panel.
-
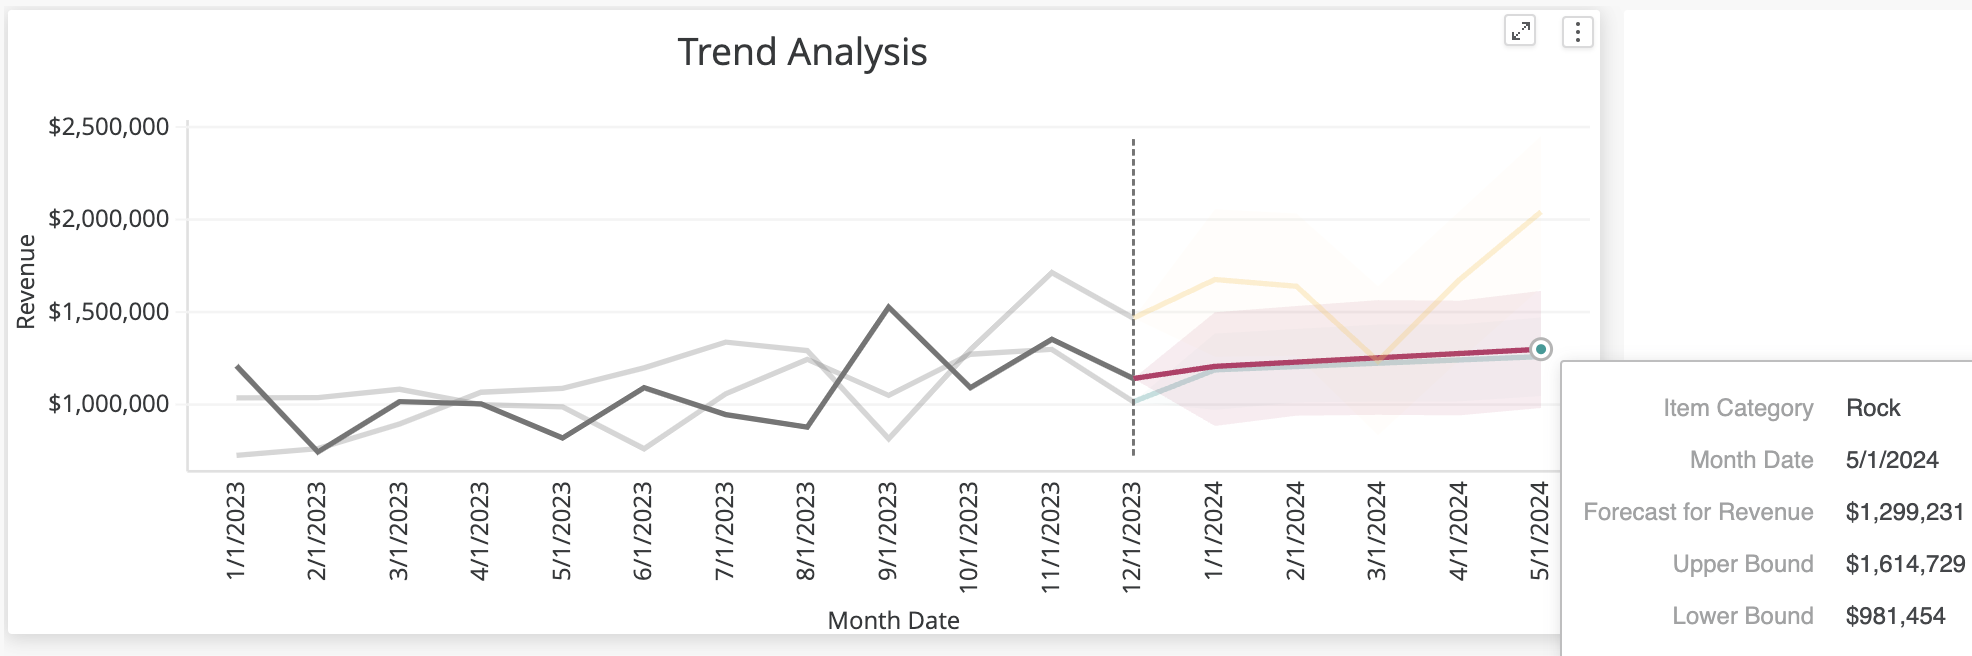
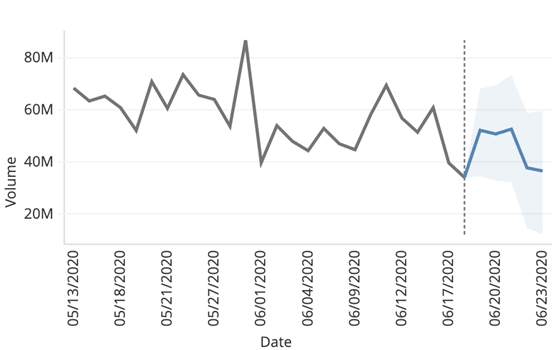
View the rendered visualization with the forecasted values on the right.
-
The default number of forecasted points is five. To change this number, go to Format panel and click Visualization Options
 . In Forecast length, change the number of forecasted points. The maximum number of forecasted points is 100.
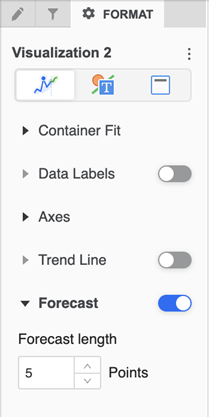
-
-