Strategy ONE
Auto Narratives
Starting in MicroStrategy ONE (September 2024), auto narratives is supported inManaged Cloud Enterprise. You can use auto narratives in Strategy Library, Library for iOS, Library for Android, and Workstation when you connect to a Library server.
Auto narratives simplifies data interpretation by transforming complex visualizations into easy-to-understand natural language summaries. This enhances data accessibility, reduces the time needed to identify key insights, and makes data comprehensible to users of all technical backgrounds. Users can generate customizable summaries for entire dashboard pages or specific visualizations, ensuring relevance by respecting any filters applied. Narratives are updated when underlying data changes, maintaining accuracy and context. This supports faster decision-making and caters to various user needs, from technical experts to non-technical stakeholders.
Prerequisites
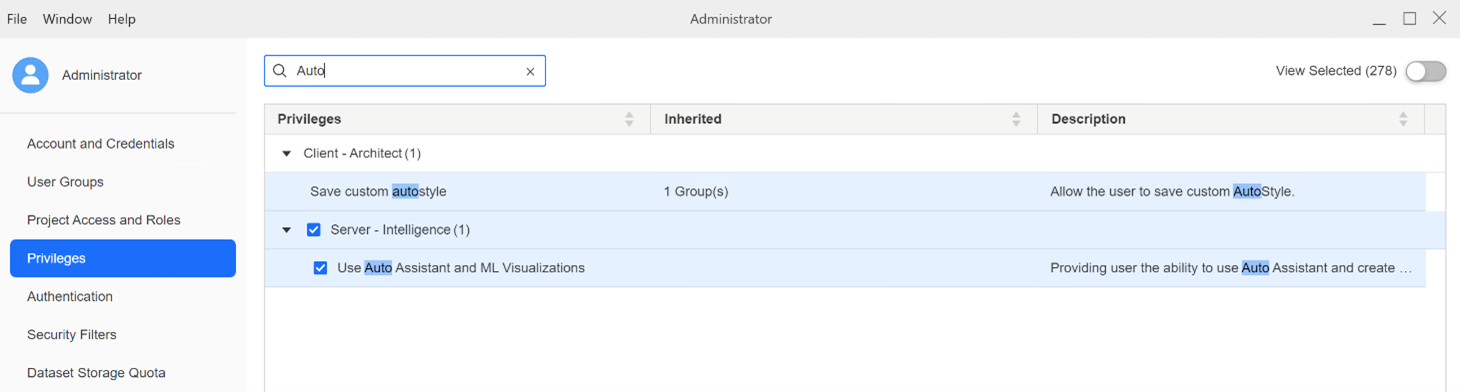
Auto narratives is part of the Strategy AI add-on bundle and is available for Managed Cloud Enterprise (MCE) customers starting in MicroStrategy ONE (September 2024). Only users and user groups with the Use Auto Assistant and ML Visualizations privileges can access auto narratives.
Create Auto Narratives
Dashboard authors can create auto narratives.
-
Open a dashboard in edit mode.
-
In the top right of an existing visualization, click More
 and choose Create Auto Narratives. By editing an existing visualization instead of creating a new one, auto narratives automatically generates a general summary of an existing visualization. This summary can be modified later to reflect an output that suits your business needs.
If necessary, you can create a new auto narratives dashboard by clicking

-
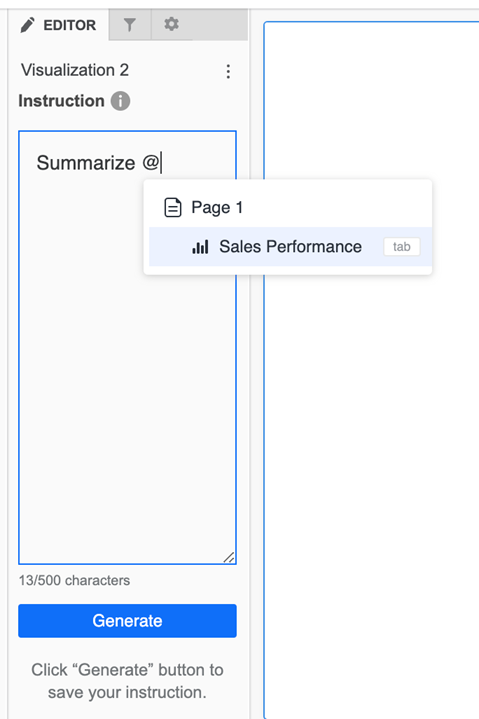
On the Editor panel, enter @ in Instruction to select the current page or specific visualizations you want auto narratives to summarize. Describe your request in detail to identify key insights and display them in a formatted summary.
-
Click Generate.
-
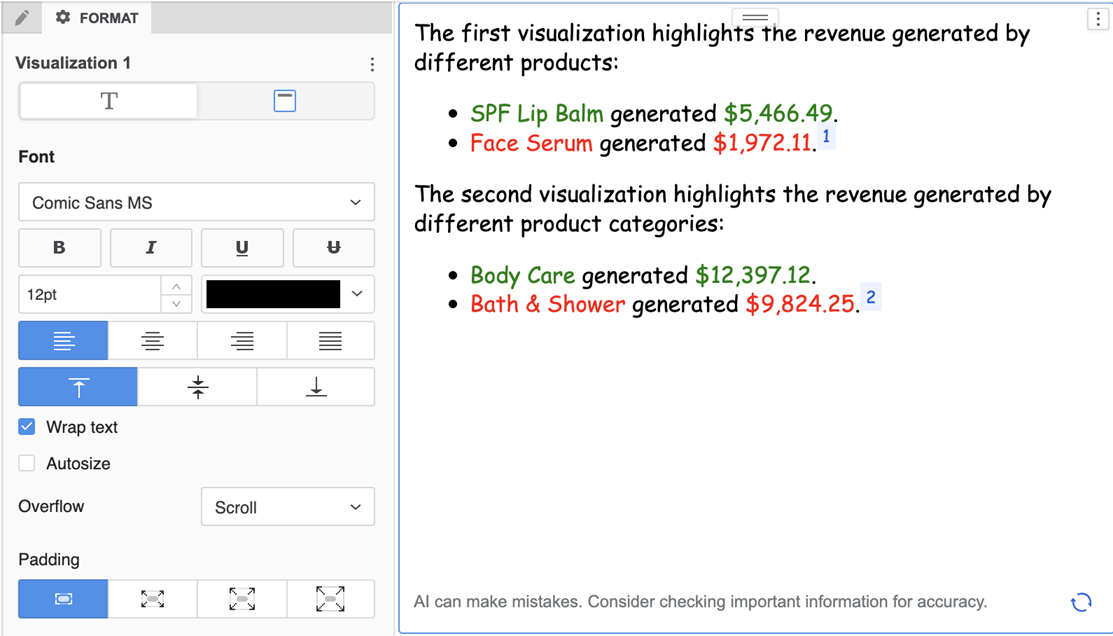
Use the Format panel to modify the text.
Consume Auto Narratives
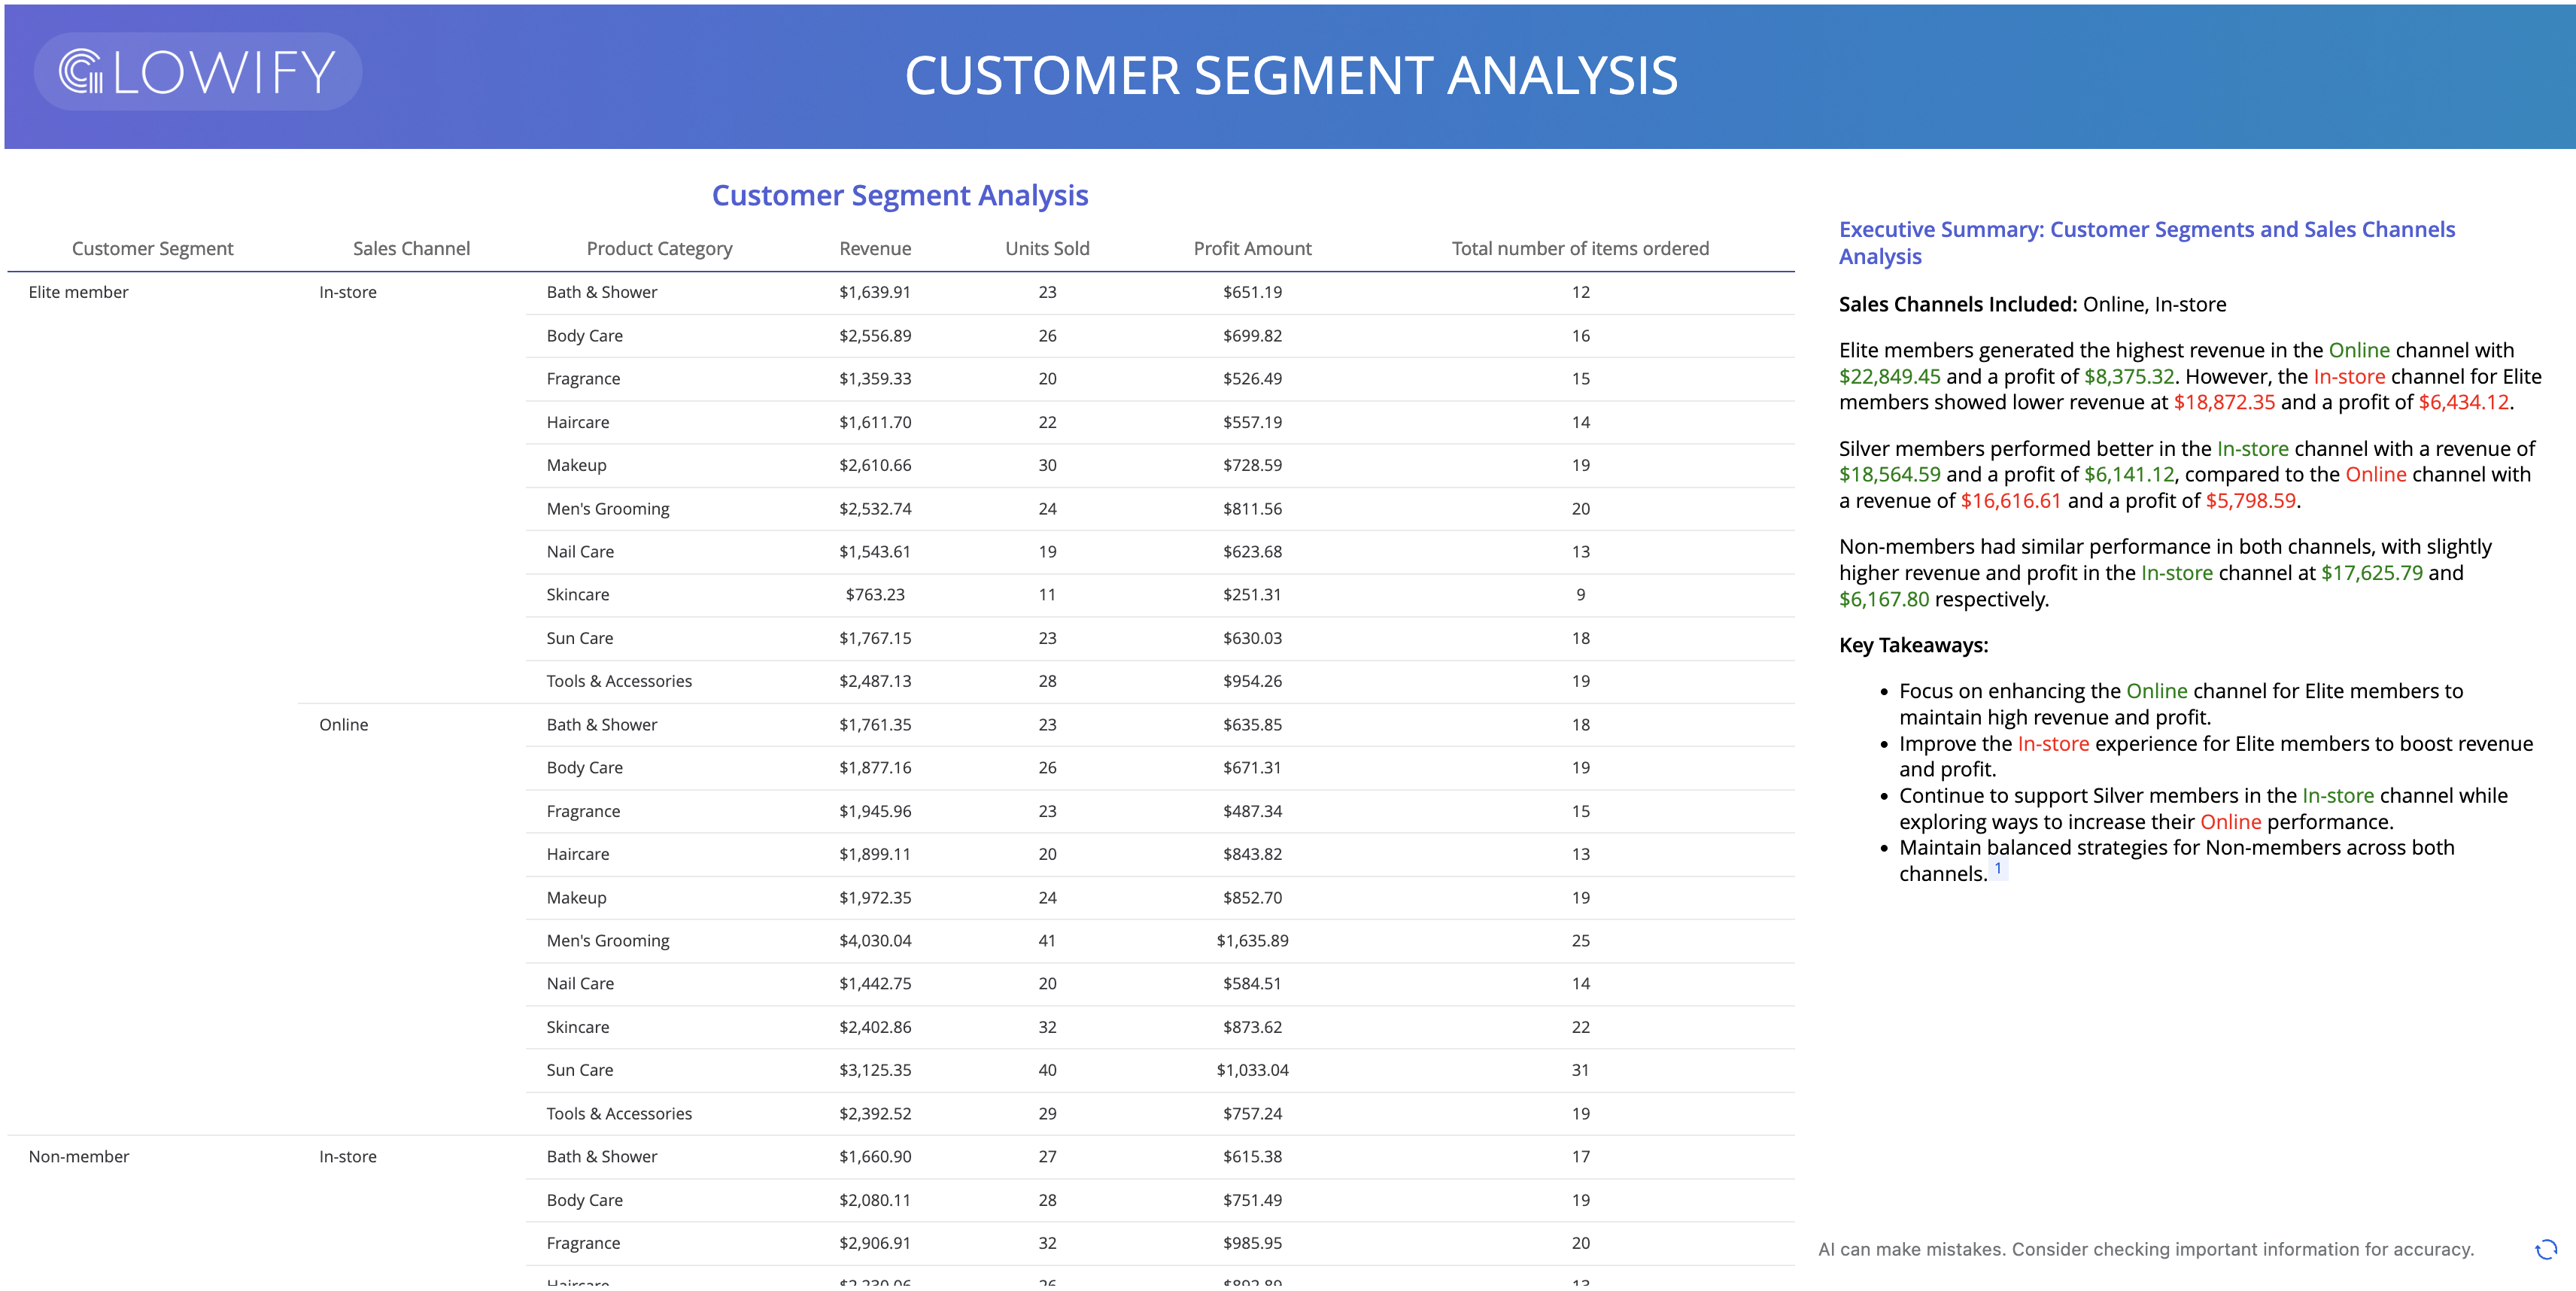
Business users can view auto narratives directly within dashboards, where they are presented as concise, natural language summaries of key insights. Once these narratives are created by dashboard authors, these summaries are tailored to provide you with the most relevant information based on the underlying data and filters applied. You'll be able to see these insights dynamically adjust as you interact with the dashboard, ensuring you always have access to the latest and most pertinent data.
-
Click Refresh
 to update the summary.
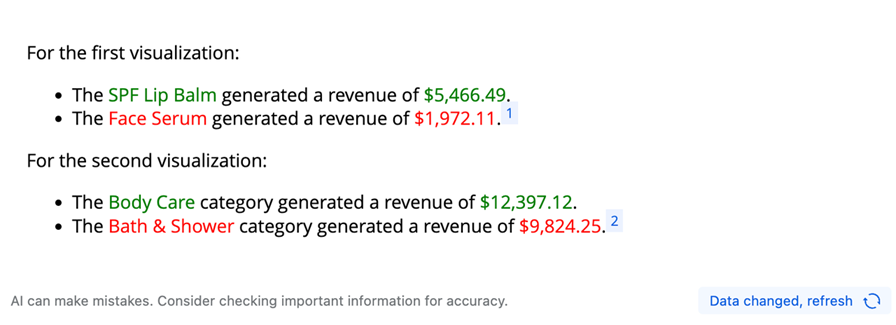
-
To copy the text with its formatting, hover over the top right and click Copy
 .
.
For every auto narrative, there is a corresponding cache containing summary data. The cache is invalidated when the dataset is refreshed or the document definition is modified.
Best Practices
Source Data
Auto narratives can only generate summaries based on the page it is currently located on or the visualizations within that same page. To summarize visualizations within a panel stack, ensure that the auto narratives is added to the same panel as the target visualization. It is not yet possible to use auto narratives to summarize content from other pages or visualizations located outside the current page.
If visualizations are controlled by attribute or metric selectors, any changes to the attributes or metrics of the target visualization may affect the summary's accuracy. In such cases, click Generate to regenerate the summary for the correct result.
Instructions
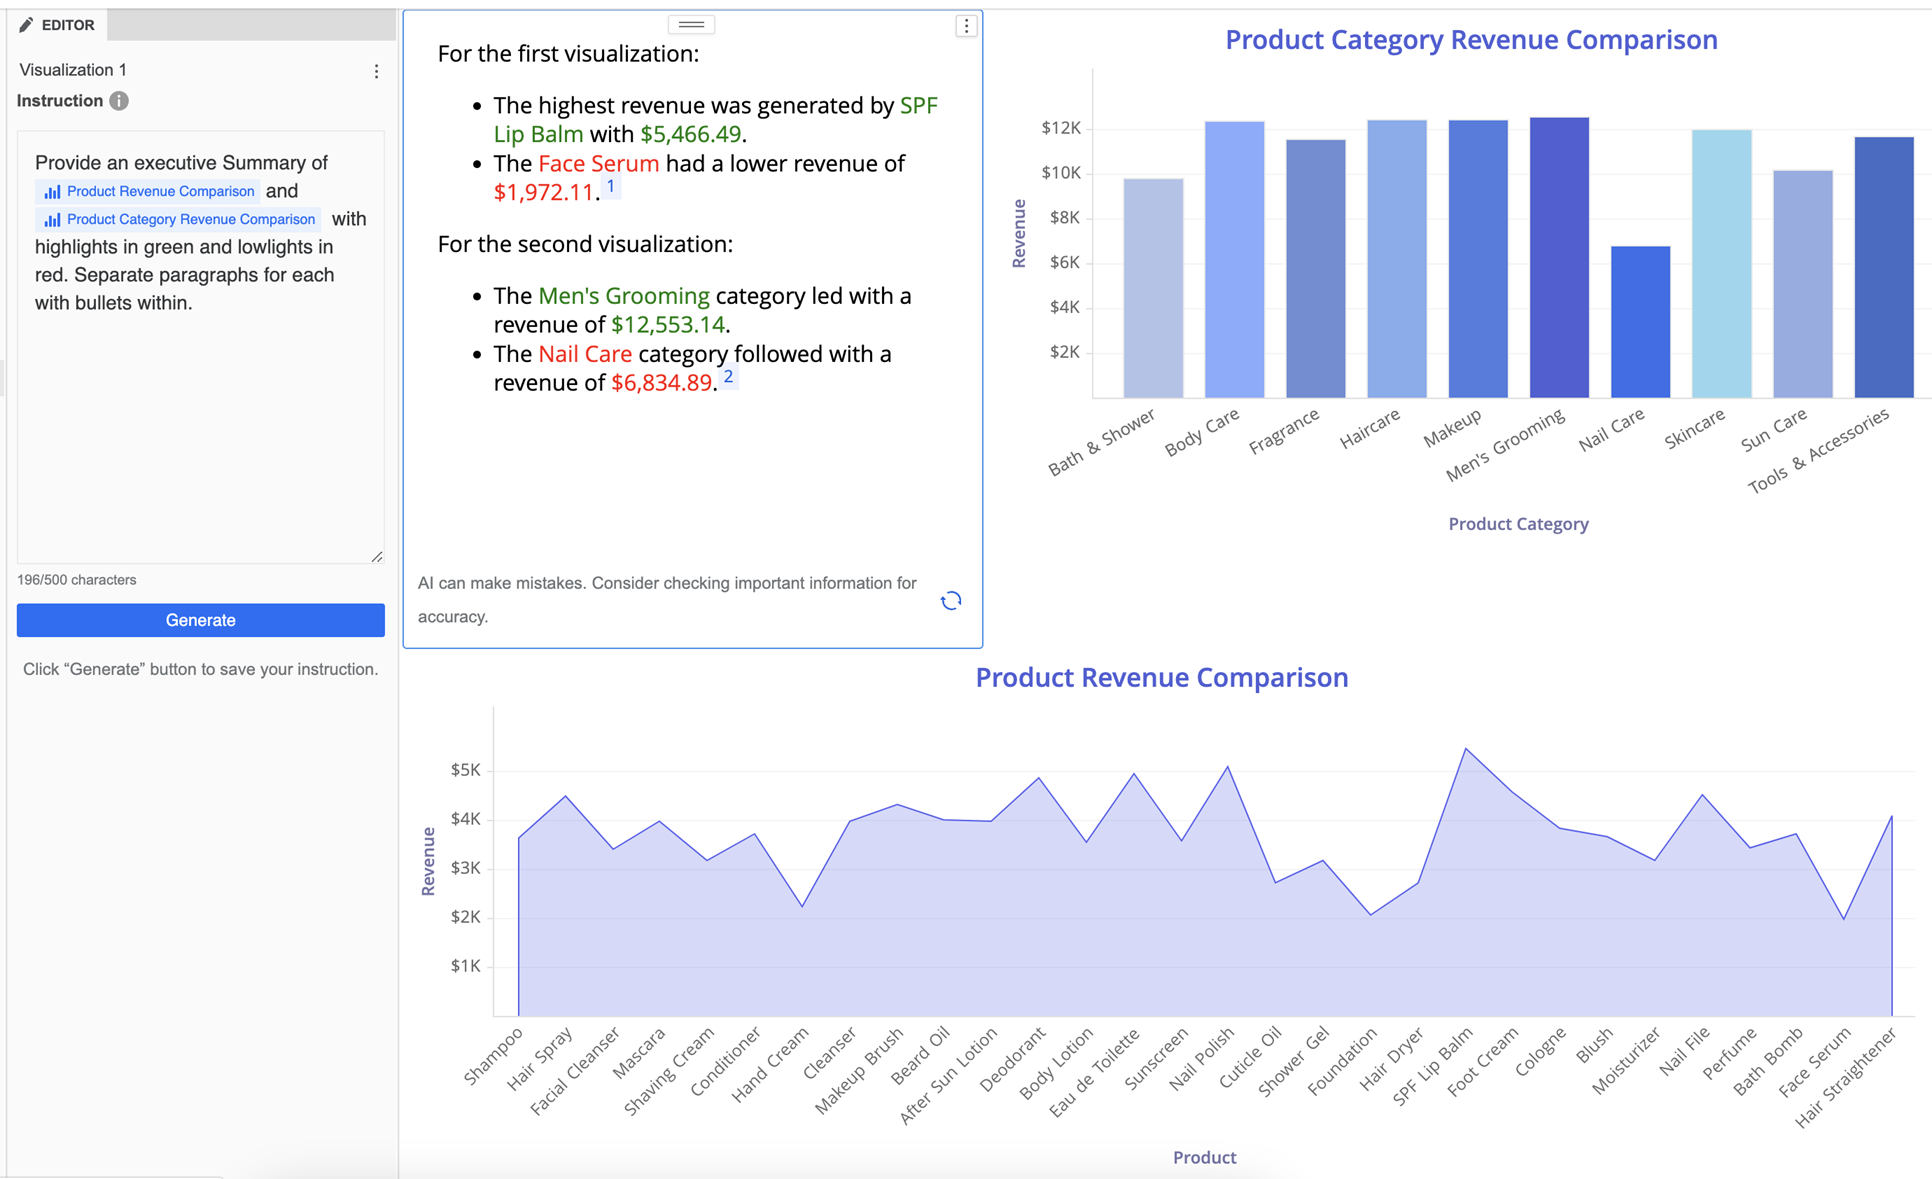
When setting up auto narratives, provide clear and specific instructions to get the best summary output. If you don’t provide specific instructions, auto narratives generally displays highlights, lowlights, key drivers, or trends if applicable. If the summary does not meet your expectations, modify the instructions and click Generate, as the structure of the outcomes can vary based on the data and visualizations used.
Formatting
Provide detailed instructions for custom formatting. Auto narratives supports rich HTML formatting, allowing you to customize font color, size, styles, images, bullets, titles, and paragraphs.
After generating and saving an auto narrative in the dashboard, it’s best to avoid drilling down on the data in the visualizations targeting auto narratives. Drilling could remove the attributes or metrics referenced in the instruction, potentially leading to incorrect results.
Managing Footnotes
A footnote for a single source visualization may appear in multiple paragraphs within an auto narratives visualization. If you prefer to not display the footnote, simply include instructions such as "don’t show the footnote."
Accuracy in Filtering Instructions
When providing instructions for filtering data, such as “display the revenue for region 'Northeast’,” ensure that 'Northeast' matches the exact capitalization and spelling as it appears in your dataset. This helps prevent errors and ensures the query retrieves the intended data accurately.
For more detailed information on tracking and analyzing the usage of auto narratives, see Auto Narratives Insights.
Limitation
Auto Narratives may generate incorrect results for some smart metrics, such as "Profit Margin". This result is due to Auto Narratives direct calculation based on the data present in the visualization. To ensure the summary result meets your expectations, dashboard authors should review the result to ensure it meets your expectations.
Narrative Sales Template
Analyze this sales data visual and deliver a comprehensive performance report with profit optimization insights. The following instructions are mandatory for consistency:
-
Color coding:
-
Use green to indicate any increases in values
-
Use red to indicate any decreases in values
-
Try to use percentage changes where possible
-
-
Directional indicators:
-
Place an upward green triangle in front of any increases in numbers.
-
Place a downward red triangle in front of any decreases in numbers.
-
-
Consistent formatting:
-
Apply bold text, color-coded arrows, and blank line separation uniformly across all responses.
-
Separate each key takeaway by a blank line and ensure each takeaway aligns and is not indented.
-
Logical format: Follow the same structure for all responses: Summary > Sales Metrics Breakdown > Strategic Action > Future Steps.
-
-
Strategic actions:
-
Provide likely market drivers and tactical sales strategies to address declining performance or amplify growth momentum. Put the word "Action" in the color orange followed by specific, measurable recommendations with timelines where applicable.
-
-
Example:
-
For example, if sales went down by 5%, you should write ▼ 5% and if sales went up by 5%, you should write ▲ 5%.
-
-
Include all data trends: Address both increases and decreases for relevant metrics. Always avoid omissions, even why only positive or negative trends are highlighted.
-
Uniform terminology: Use standardized wording for all metrics (for example, always refer to "Year-over-Year Growth Rate" rather than synonyms).
-
SMART recommendations: Include actionable, specific, measurable, achievable, relevant, and timely strategies for both growth and improvement.
Focus on these metrics in order of priority:
-
[Total Revenue]
-
[Year-over-Year Growth Rate]
-
[Sales by Product/Channel]
-
[Customer Acquisition Cost]
-
[Average Deal Size]
-
[Conversion Rates by Stage]
-
[Sales Cycle Length]
-
[Rep Performance Distribution]
-
[Customer Retention Rate]
-
[Pipeline Velocity]
Present insights as a strategic business briefing suitable for sales leadership, emphasizing revenue impact and competitive positioning. Include a summary statement starting with "This summary highlights..." before examining specific performance metrics.