Strategy One
Add KPIs to Insights
In the latest release, Strategy Insights are only supported on the Managed Cloud Enterprise (MCE) and Managed Cloud Government(MCG) platforms in StrategyLibrary for Web and Mobile.
Support for Library Web on MCG started in MicroStrategy 2021 Update 7 (September 2022)
Support for Library Web on MCE started on MicroStrategy 2021 Update 8 (December 2022)
Support for Library Mobile for iOS and Android started in MicroStrategy 2021 Update 9 (March 2023)
A KPI (Key Performance Indicator) visualization is a visual representation of a performance indicator, that is a main data point in a dashboard. You can visualize the total value of a metric or how a metric, such as profit or revenue, trends over time. A KPI visualization may contain one or more attributes and at least one metric. Not all visualizations in dashboards support Insights. Currently, only basic KPI visualizations are supported by Insights. See Create a KPI Visualization for more information. In addition, KPIs with break-by attributes are not supported.
- Web
- Mobile
Add KPIs to Your Personalized Insights Page in Library
Add a KPI from your preferred dashboard to the Insights page.
-
Open a dashboard that displays the KPIs you want to track using Insights.
-
In the KPI, click More
 and choose Add to Insights. Each user can save up to thirty KPIs on their Insights page.
 -
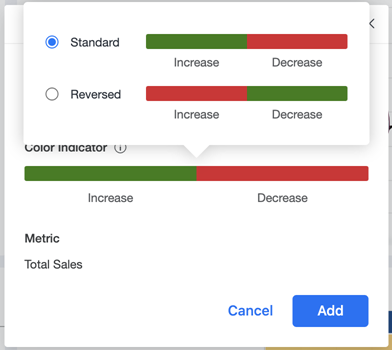
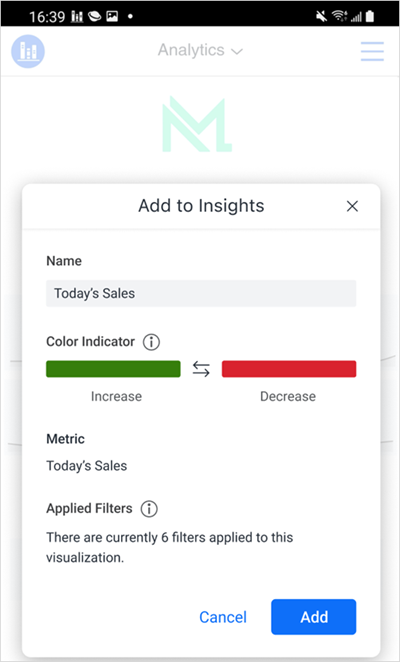
Name your KPI and choose a Color Indicator by clicking the color bar. This defines how changes are tracked for the KPI.
-
Click Add.
Add KPIs to Your Personalized Insights Page in Library
Add a KPI from your preferred dashboard to the Insights page.
-
Open a dashboard that displays the KPIs you want to track using Insights.
-
Tap and hold the visualization to open a menu. Then tap
 to add it to Insights. Each user can save up to thirty KPIs on their Insights page.
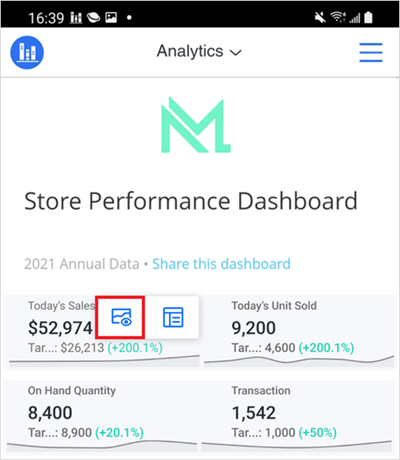
-
Name your KPI and choose a Color Indicator by clicking the color bar. This defines how changes are tracked for the KPI.
-
Click Add.