Strategy ONE
Dataset Objects panel
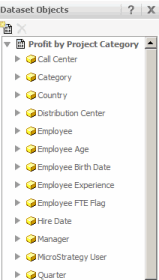
The Dataset Objects panel contains all of the items that can be placed on the document, organized by dataset.

These items include attributes, metrics, custom groups, and consolidations from any dataset that has been added to the document, regardless of whether or not the items are displayed on the report. For example, if a metric is part of the report's dataset but not displayed on the grid, that metric is still listed as a dataset object.
Standard MicroStrategy reports, freeform SQL reports, Query Builder reports, MDX cube reports, and reports created using the Data Import feature can be used as datasets in documents. You can also directly import data into the document, for example, from an Excel file or a database; the imported data is used as a dataset.
You can link imported data to project attributes. For steps, see the Dashboards and Widgets Creation Guide.
To display the Dataset Objects pane, click Dataset Objects at the bottom of the accordion pane. If the accordion pane is not displayed, select ![]() from the Tools toolbar or Dataset Objects from the Tools menu.
from the Tools toolbar or Dataset Objects from the Tools menu.
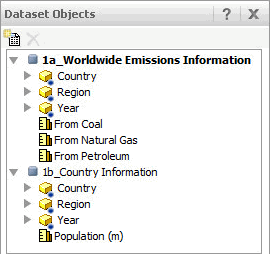
The Dataset Objects panel first displays the name of each dataset in the document, then lists the objects used in it. If multiple datasets are included on the document, the name of the grouping and sorting dataset is displayed with bold text. Any attribute used in multiple imported datasets is displayed with a blue indicator. In the example below, Worldwide Emissions Information is the grouping and sorting dataset (indicated by the bolded dataset name), and the Country, Region, and Year attributes are used in both imported datasets (designated by the blue indicator). For more information about datasets in a document, see Using datasets in documents.

To place an object on a document, drag it from the Dataset Objects panel and drop it onto the Layout area. This creates a text field on the Layout area. For more information on creating text fields, see Adding text and data to a document: Text fields.
To place a dataset on a document, drag and drop a dataset name from the Dataset Objects panel to the Layout area. This creates a Grid/Graph. For more information on Grid/Graphs, see Displaying Reports in Documents: Grid/Graphs.
