Strategy One
The R Integration Pack is no longer supported as of December 2024.
Provide Statistical Analysis from R Analytics
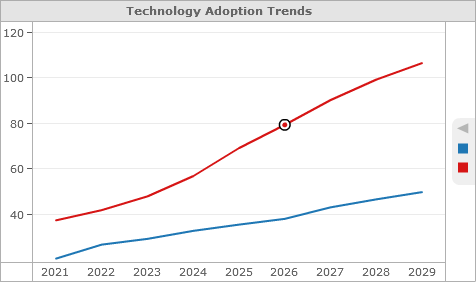
You can perform statistical analysis in MicroStrategy Workstation using R analytics. Once an R script is deployed to MicroStrategy Workstation as a derived metric, the statistical analysis can be added to and analyzed on visualizations. An example of trend analysis is shown below.

MicroStrategy Workstation supports the deployment of R analytics from the R statistical environment as derived metrics. R is an open-source language and environment for statistical computing and graphics. The third-party R environment is freely available, as a separate download.
The MicroStrategy R Integration Pack must be installed and configured on the same machine as MicroStrategy Workstation.
- Download the R Integration Pack.
- Download the R Integration Pack User Guide for steps to install and configure the R Integration Pack, as well information on how to use the deployR utility to create metric expressions for R scripts.
The dashboard on which you create the derived metric for the R script must contain the metrics required to support the statistical analysis. If an R script requires three inputs to define the target, trend, and season for a statistical analysis, the dashboard must include three metrics that can supply the data for those three inputs.
- Open the dashboard you want to modify.
- At the top of the Datasets panel, click More
 and choose Create Metric. The Metric Formula Editor opens.
 - Type a name for the metric in the Metric Name field.
- Copy the metric expression, that describes the R script, from the deployR utility of the R Integration Pack.
- Paste the metric expression into the Formula field.
- Map all of the inputs for the metric expression, which are included in parentheses and separated by commas at the end of the metric expression, to metrics available in the dashboard. Each input must map to one metric in the dashboard.
- Click Save.
Related Topics
Derived Metrics: Metrics Based on Existing Objects
Create a Derived Metric Using the Metric Function Editor
Create a Derived Metric On a Grid Using a Shortcut
Create a Derived Metric by Combining Two Metrics with an Operator
Create a Derived Metric by Combining Multiple Metrics
Create a Derived Metric by Selecting the Aggregation Function
Create a Derived Metric from an Attribute
Create a Derived Metric from Scratch Using the Metric Formula Editor
Add Conditional Calculations to a Derived Metric Using the If and Case Functions
Change the Aggregation and Subtotal Behavior for a Derived Metric
Edit Derived Metrics from the Dashboard
