Strategy ONE
Remove Missing Units in Documents
If you remove or replace a dataset, controls on the document that contain data that is no longer available from the dataset will be updated and will no longer contain data from the replaced or removed dataset. For a Grid/Graph, objects that are available in another dataset are updated to contain data from the other dataset. The Remove Missing Units in Documents property then determines how any objects that are still missing are displayed in Grid/Graphs:
- Remove objects not available in the source dataset(s): The missing objects are not displayed in the Grid/Graph. If the Grid/Graph only contains missing objects, it is displayed as an empty placeholder.
- Do not remove objects not available in the source dataset(s): The headers for the missing objects are displayed in the Grid/Graph, without any data. MicroStrategy recommends that objects missing from datasets are displayed. This can alert you if objects are removed from a report used as a dataset.
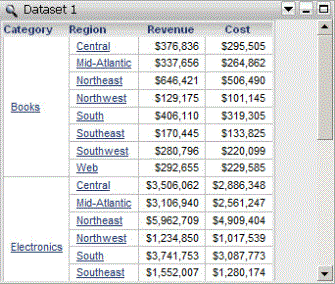
For example, a document contains two datasets. Dataset 1 has Category, Region, and the Revenue and Cost metrics. Dataset 2 has Category, Subcategory, and the Revenue and Profit metrics. A Grid/Graph containing the objects from Dataset 1 is displayed on the document. A portion of the Grid/Graph is shown below, in Interactive Mode in MicroStrategy Web:

Dataset 1 is removed from the document. Because Category and Revenue are available from Dataset 2, they continue to be displayed on the Grid/Graph. Since Region and Cost are no longer available in any dataset on the document, they are considered missing objects. Which option is selected in the Remove Missing Units in Documents property then determines how any objects that are still missing are displayed in Grid/Graphs, as described below:
-
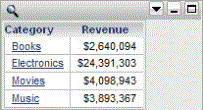
Remove objects not available in the source dataset(s): The missing objects are not displayed in the Grid/Graph, as shown below:

-
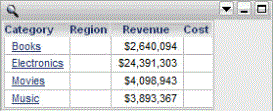
Do not remove objects not available in the source dataset(s): Headers for the missing objects are displayed in the Grid/Graph, as shown below:

Regardless of the property setting, a text field that contains a dataset object (such as an attribute or a metric) will display the object name instead of values. For example, a text field displays {Region} instead of North, South, and so on.
For an example that uses multiple datasets in a single Grid/Graph, see the Document Creation Help.
Levels at Which You Can Set This
Project and document
