Strategy ONE
How the Network can Affect Performance
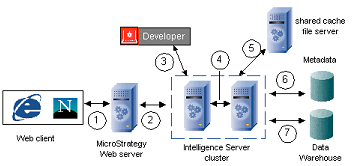
The various components of the MicroStrategy system need to be installed on different machines for performance reasons. The network plays an important role in connecting these components. In the diagram below, the separate components of the MicroStrategy system are linked by lines representing the network. The steps that occur over each connection are described in the table below the diagram.
|
Step |
Protocol |
Details |
|
1 |
HTTP/HTTPS |
HTML sent from Web server to client. Data size is small compared to other points because results have been incrementally fetched from Intelligence Server and HTML results do not contain any unnecessary information. |
|
2 |
TPC/IP or TLS/SSL |
XML requests are sent to Intelligence Server. XML report results are incrementally fetched from Intelligence Server. |
|
3 |
TCP/IP or TLS/SSL |
Requests are sent to Intelligence Server. (No incremental fetch is used.) |
|
4 |
TCP/IP or TLS/SSL |
Broadcasts between all nodes of the cluster (if implemented): metadata changes, Inbox, report caches. Files containing cache and Inbox messages are exchanged between Intelligence Server nodes. |
|
5 |
TCP/IP or TLS/SSL |
Files containing cache and Inbox messages may also be exchanged between Intelligence Server nodes and a shared cache file server if implemented (see Sharing Result Caches and Intelligent Cubes in a Cluster). |
|
6 |
ODBC |
Object requests and transactions to metadata. Request results are stored locally in Intelligence Server object cache. |
|
7 |
ODBC |
Complete result set is retrieved from database and stored in Intelligence Server memory and/or caches. |
The maximum number of threads used in steps 2 and 3 can be controlled in the Intelligence Server Configuration Editor, in the Server Definition: General category, in the Number of Network Threads field. Depending on how your network is configured, one network thread may be sufficient to serve anywhere from 64 to 1028 user connections.
Network Configuration Best Practices
The network configuration, that is, where the components are installed in relation to each other, can have a large effect on performance. For example, if the physical distance between Intelligence Server and the data warehouse is great, you may see poor performance due to network delays between the two machines.
MicroStrategy recommends the following best practices for network design:
- Place the Web server machines close to the Intelligence Server machines.
- Place Intelligence Server close to the both the data warehouse and the metadata repository.
- Dedicate a machine for the metadata repository.
- If you use Enterprise Manager, dedicate a machine for the Enterprise Manager database (statistics tables and data warehouse).
- If you have a clustered environment with a shared cache file server, place the shared cache file server close to the Intelligence Server machines.
Network Bandwidth and How its Capacity is Used
Your network design depends on the type of reports that your users typically run. These reports, in turn, determine the load they place on the system and how much network traffic occurs between the system components.
The ability of the network to quickly transport data between the components of the system greatly affects its performance. For large result sets, the highest load or the most traffic typically occurs between the data warehouse and the Intelligence Servers (indicated by C in the diagram below). The load between Intelligence Server and Web server is somewhat less (B), followed by the least load between the Web server and the Web browser (A).
This is illustrated in the diagram and explained below.
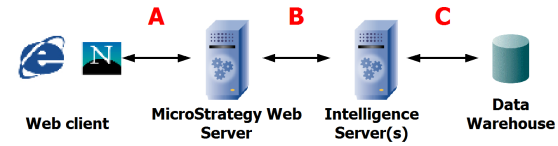
- Incremental fetch size directly influences the amount of traffic at A.
- Graphics increase network bandwidth at B.
- The load at C is determined primarily by the number of rows retrieved from the data warehouse. Actions such as sending SQL or retrieving objects from the metadata result in minimal traffic.
- Cached reports do not cause any network traffic at C.
- Report manipulations that do not cause SQL to be generated and sent to the data warehouse (such as pivot, sort, and page-by) are similar to running cached reports.
- Report manipulations that cause SQL to be generated and sent to the data warehouse are similar to running non-cached reports of the same size.
After noting where the highest load is on your network, you can adjust your network bandwidth or change the placement of system components to improve the network's performance.
You can tell whether your network configuration has a negative effect on your system's performance by monitoring how much of your network's capacity is being used. Use the Windows Performance Monitor for the object Network Interface, and the watch the counter Total bytes/sec as a percent of your network's bandwidth. If it is consistently greater than 60 percent (for example), it may indicate that the network is negatively affecting the system's performance. You may want to use a figure different than 60 percent for your system.
To calculate the network capacity utilization percent, take the total capacity, in terms of bits per second, and divide it by (Total bytes per second * 8). (Multiply the Total Bytes per second by 8 because 1 byte = 8 bits.)
The Current Bandwidth counter in Performance Monitor gives an approximate value of total capacity because it is only an estimate. You may want to use another network monitoring utility such as NetPerf to get the actual bandwidth figure.